collapse

* '23-'24 SOTG Tally


2023-24 Season SoG Tally
Kolek11
Ighodaro6
Jones, K.6
Mitchell2
Jones, S.1
Joplin1

'22-23
'21-22 * '20-21 * '19-20
'18-19 * '17-18 * '16-17
'15-16 * '14-15 * '13-14
'12-13 * '11-12 * '10-11

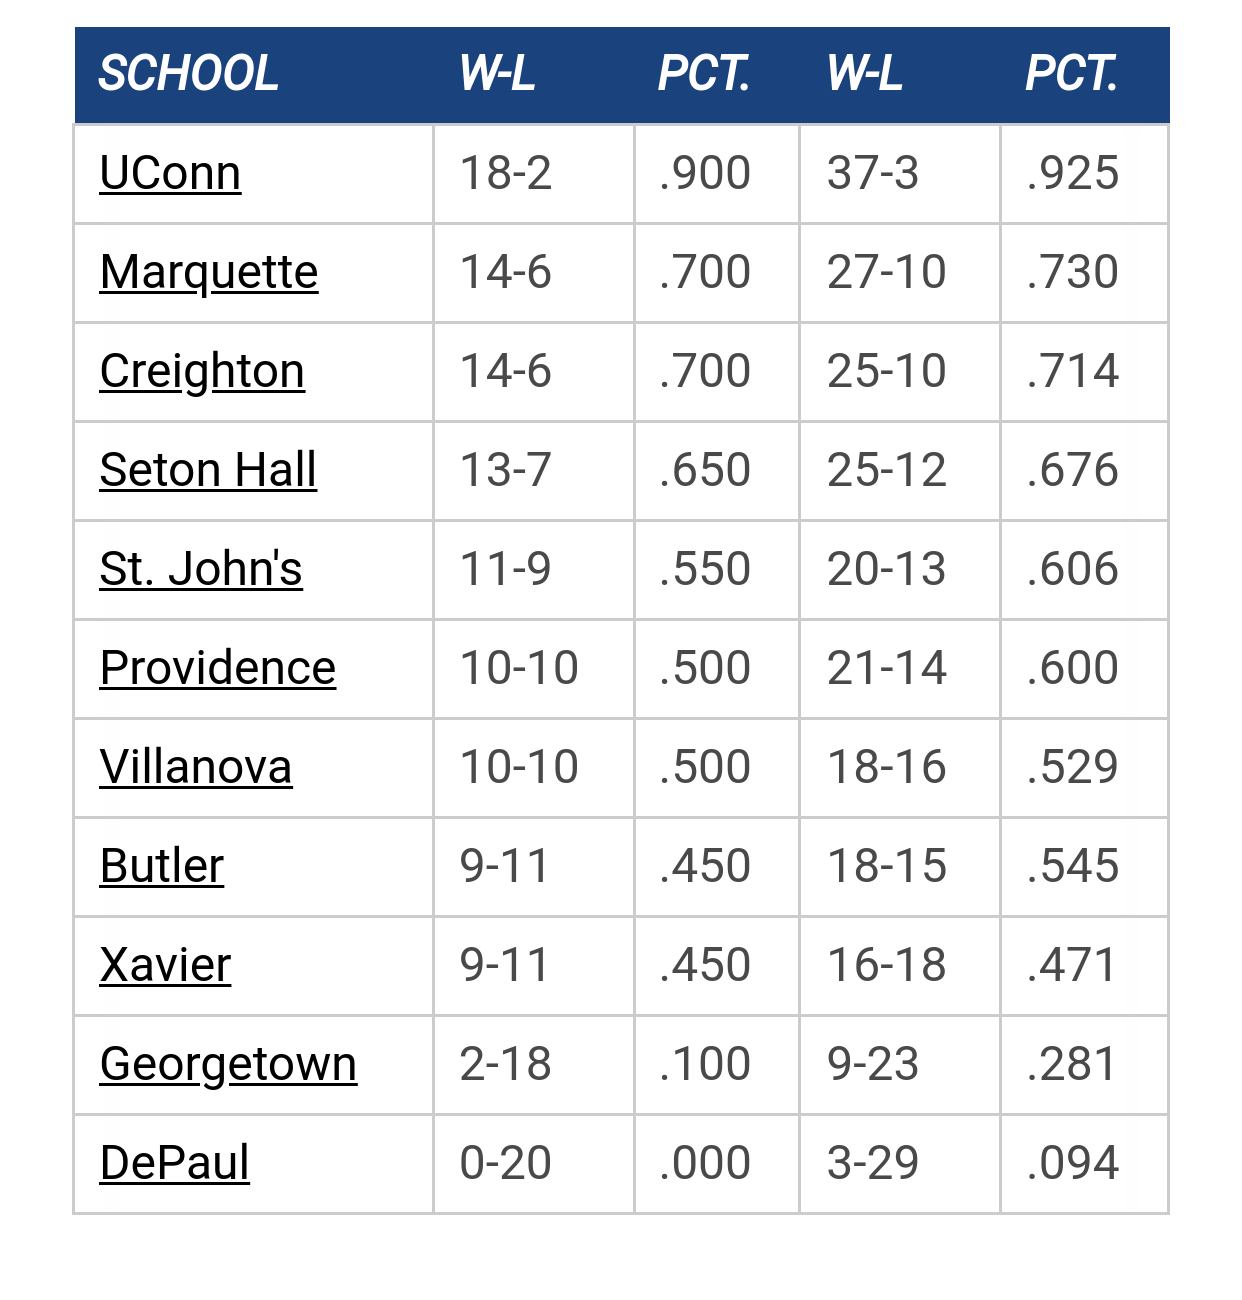
* Big East Standings

* Recent Posts

2024 Transfer Portal by Viper
[Today at 07:03:56 AM]


Marquette transfers, this millennium by tower912
[Today at 06:45:47 AM]


Big East 2024 Offseason by PointWarrior
[Today at 12:57:23 AM]


2024-25 Outlook by PointWarrior
[April 30, 2024, 11:37:53 PM]


Shaka interview by Jay Bee
[April 30, 2024, 09:36:41 PM]


Recruiting as of 3/15/24 by MU82
[April 30, 2024, 04:18:31 PM]


D-I Logo Quiz by IL Warrior
[April 30, 2024, 02:09:27 PM]

Please Register - It's FREE!

The absolute only thing required for this FREE registration is a valid e-mail address.  We keep all your information confidential and will NEVER give or sell it to anyone else.
Login to get rid of this box (and ads) , or register NOW!

* Next up: The long cold summer

Marquette
Marquette

Open Practice

Date/Time: Oct 11, 2024 ???
TV: NA
Schedule for 2023-24
27-10

Author Topic: Big East Poll , NET Rankings and Team Sheets  (Read 134520 times)

The Equalizer

  • All American
  • *****
  • Posts: 1778
Re: Big East Poll , NET Rankings and Team Sheets
« Reply #175 on: December 20, 2022, 08:01:44 AM »
Quote from: LAZER link=topic=63697.msg1492096#msg1492096 date=
The bottom of the ACC is terrible, not sure what you mean by this. The last 4 years for the ACC has been rough. They clearly have premier programs at the top, but the middle and bottom of the conference have been on a slide.

My point is consistent with the bid maximizing formula to to concentrate as many losses as possible in the smallest number of teams at the bottom, and the most possible teams .500 or above.

In 2017, the ACC did just that, with only 5 teams below .500, and those five combined for just 24 wins.  They concentrated a ton of losses across a small number of teams and wound up with 9 bids--their most ever.

In 2022, the ACC violated this formula and saw 7 teams finish below .500, and those teams combined for 44 wins.  They only got 5 bids.

Consider the same situation from a Big East perspective: Last year Xavier was 8-11 in the conference (plus a loss to Butler in the BET).  DePaul beat them once, and St. Johns beat them twice. Xavier took three losses to sub .500 teams.  If Xavier wins those three games, they're 11-8 and in all likelihood in the NCAA tournament, giving the Big East an extra bid.

On the other hand, if Georgetown was a bit better,  they may have taken wins from Marquette and Seton Hall knocking them out of the NCAA tournament.  4 wins for Georgetown would have still kept them in last place, but if 2 were agains Seton Hall, and 2 were against Marquette, both teams would have been 9-10 instead of 11-8, and both teams likely would have been left out.

Compare the bottom of the Big East to the bottom of the ACC.  NC State was terrible, but they still won 4 games, including one over Virginia Georgia Tech was terrible, but they still won 5 games, including one over Wake Forest.  BC was terrible, but they still beat Wake in the ACC tournament.  The bottom of the ACC was better than the bottom of the Big East, which is why the middle of the Big East was better than the middle of the ACC.


TAMU, Knower of Ball

  • All American
  • *****
  • Posts: 22168
  • Meat Eater certified
Re: Big East Poll , NET Rankings and Team Sheets
« Reply #176 on: December 20, 2022, 08:38:20 AM »
My point is consistent with the bid maximizing formula to to concentrate as many losses as possible in the smallest number of teams at the bottom, and the most possible teams .500 or above.

In 2017, the ACC did just that, with only 5 teams below .500, and those five combined for just 24 wins.  They concentrated a ton of losses across a small number of teams and wound up with 9 bids--their most ever.

In 2022, the ACC violated this formula and saw 7 teams finish below .500, and those teams combined for 44 wins.  They only got 5 bids.

You are correct. But the ACC accomplished this by the top/middle getting worse rather than the bottom getting better. The conference as a whole has been down for the past 4 years.
TAMU

I do know, Newsie is right on you knowing ball.


Dr. Blackheart

  • All American
  • *****
  • Posts: 13061
Re: Big East Poll , NET Rankings and Team Sheets
« Reply #177 on: December 20, 2022, 08:40:55 AM »
My point is consistent with the bid maximizing formula to to concentrate as many losses as possible in the smallest number of teams at the bottom, and the most possible teams .500 or above.

In 2017, the ACC did just that, with only 5 teams below .500, and those five combined for just 24 wins.  They concentrated a ton of losses across a small number of teams and wound up with 9 bids--their most ever.

In 2022, the ACC violated this formula and saw 7 teams finish below .500, and those teams combined for 44 wins.  They only got 5 bids.

Consider the same situation from a Big East perspective: Last year Xavier was 8-11 in the conference (plus a loss to Butler in the BET).  DePaul beat them once, and St. Johns beat them twice. Xavier took three losses to sub .500 teams.  If Xavier wins those three games, they're 11-8 and in all likelihood in the NCAA tournament, giving the Big East an extra bid.

On the other hand, if Georgetown was a bit better,  they may have taken wins from Marquette and Seton Hall knocking them out of the NCAA tournament.  4 wins for Georgetown would have still kept them in last place, but if 2 were agains Seton Hall, and 2 were against Marquette, both teams would have been 9-10 instead of 11-8, and both teams likely would have been left out.

Compare the bottom of the Big East to the bottom of the ACC.  NC State was terrible, but they still won 4 games, including one over Virginia Georgia Tech was terrible, but they still won 5 games, including one over Wake Forest.  BC was terrible, but they still beat Wake in the ACC tournament.  The bottom of the ACC was better than the bottom of the Big East, which is why the middle of the Big East was better than the middle of the ACC.

The old Sigmoid Curve

The Equalizer

  • All American
  • *****
  • Posts: 1778
Re: Big East Poll , NET Rankings and Team Sheets
« Reply #178 on: December 20, 2022, 12:23:46 PM »
Quote from: TAMU, the Wizard of MU Basketball link=topic=63697.msg1492229#msg1492229 date=
You are correct. But the ACC accomplished this by the top/middle getting worse rather than the bottom getting better. The conference as a whole has been down for the past 4 years.


First off, the top 2 teams both made the Final Four.  Not a sign of being down.  That leaves only the middle and bottom to consider.

Based on bids received, I don't see the conference as a whole being down for the past 4 years

2014: 6 bids
2015: 6 bids
2016: 7 bids
2017: 9 bids
2018: 6 bids
2019: 7 bids
2021: 7 bids
2022: 5 bids

At best, you could say 2022 was below average--but it was the lowest bid total over the last decade.   The prior two year the ACC received the 2nd most bids over the same timeframe.

At best, you could say 2022 was a bad year, and certain teams were down.

But comparing the two outliers shows a significant difference in the number of games won by the teams at the bottom, which can directly impact how many bids a league earns.  We'll never know for sure, but I'm willing to assume that had Wake Forest not lost to BC or Louisville or Clemson or Georiga Tech last year, they would have made the tourney and increased the number of bids to 6.

And, yes, I saw your posting of Ken Pom averages--but in scoop vernacular, averages no matta.

1. We don't know if the difference in the underlying data is statistically significant.  You're assuming the difference between the #1 and #6 ranked conference is meaningful, but in reality, the difference could be statistically insignificant noise.

2. You're willing to assume that because the ACC fell from, say, 4th to 5th in a particular year, it can only be explained that they got worse.  But you didn't control for the possibility that the previous 5th-place leaguge improved while the ACC stayed consistent (or even improved slightly, but not as much as the previous 5th-place league).   

3. An average is meaningless when it comes to evaluating individual teams. The average rank of UConn and IUIPI right now is 182, which is mathematically correct but tells you nothing useful about either team. 


TAMU, Knower of Ball

  • All American
  • *****
  • Posts: 22168
  • Meat Eater certified
Re: Big East Poll , NET Rankings and Team Sheets
« Reply #179 on: December 20, 2022, 02:37:30 PM »
First off, the top 2 teams both made the Final Four.  Not a sign of being down.  That leaves only the middle and bottom to consider.

Two teams making a tournament run doesn't mean the entire top of a 15 team conference isn't down.

Based on bids received, I don't see the conference as a whole being down for the past 4 years

2014: 6 bids
2015: 6 bids
2016: 7 bids
2017: 9 bids
2018: 6 bids
2019: 7 bids
2021: 7 bids
2022: 5 bids

At best, you could say 2022 was below average--but it was the lowest bid total over the last decade.   The prior two year the ACC received the 2nd most bids over the same timeframe.

At best, you could say 2022 was a bad year, and certain teams were down.

What was said was last four years including this season not last 4 NCAA Tournaments. This year, the ACC is projected to have 5 bids at the moment (http://bracketmatrix.com/). This is obviously just a projection but if it holds it would be two years in a row of the lowest bids of the decade for the ACC. In 2020, the NCAAT was cancelled but the ACC was projected to have 5 bids going into the ACC tournament (http://bracketmatrix.com/matrix_2020.html). This is obviously not official but it is an accurate and objective predictor at that point in the season. You'll notice that no ACC teams that weren't already in the field received votes from 97 different bracketoligists, so it's not like any team was perceived as being close to becoming an at large.

So the last 4 years have looked more like:
2020: 5 bids
2021: 7 bids (The highest bid received by the ACC was a 4 seed which is very atypical for them)
2022: 5 bids
2023 (so far) : 5 bids

So 3 years of lowest bids in the past decade and one year of average but with no top 3 seeds.

But comparing the two outliers shows a significant difference in the number of games won by the teams at the bottom, which can directly impact how many bids a league earns.  We'll never know for sure, but I'm willing to assume that had Wake Forest not lost to BC or Louisville or Clemson or Georiga Tech last year, they would have made the tourney and increased the number of bids to 6.

Wake Forest was a 2 seed in the NIT. They would have needed to at least move up 5 spots on the S-Curve. That's probably more than one game they needed to make up but like you said, we don't know. However, Wake Forest won 13 games in the ACC that year. The fact that a 13-7 ACC team was left out of the NCAAT should tell you how the strength of the ACC was perceived. Wake was 3 games over .500 and they were still left out. Also Wake didn't lose to Georgia Tech that year.

And, yes, I saw your posting of Ken Pom averages--but in scoop vernacular, averages no matta.

1. We don't know if the difference in the underlying data is statistically significant.  You're assuming the difference between the #1 and #6 ranked conference is meaningful, but in reality, the difference could be statistically insignificant noise.

2. You're willing to assume that because the ACC fell from, say, 4th to 5th in a particular year, it can only be explained that they got worse.  But you didn't control for the possibility that the previous 5th-place leaguge improved while the ACC stayed consistent (or even improved slightly, but not as much as the previous 5th-place league).   

Okay. Instead of rank, I'll use the actual score.

22-23: 10.72
21-22: 10.69
20-21: 13.22
19-20: 11.45
18-19: 15.33
17-18: 15.71
16-17: 16.02
15-16: 16.70
14-15: 13.61
13-14: 13.04
12-13: 11.09
11-12: 10.02
10-11: 13.16
09-10: 16.34
08-09: 14.85
07-08: 14.29
06-07: 17.06
05-06: 14.07
04-05: 15.85
03-04: 20.32
02-03: 14.12
01-02: 13.61

You'll notice the 4 year average for the past 4 years is lower than any other 4 year period since 2002

3. An average is meaningless when it comes to evaluating individual teams. The average rank of UConn and IUIPI right now is 182, which is mathematically correct but tells you nothing useful about either team. 

I'm not evaluating individual teams. I'm evaluating the top to bottom strength of a 15 team conference so averages absolutely apply.
« Last Edit: December 20, 2022, 02:50:13 PM by TAMU, the Wizard of MU Basketball »
TAMU

I do know, Newsie is right on you knowing ball.


Herman Cain

  • All American
  • *****
  • Posts: 12897
  • 9-9-9
Re: Big East Poll , NET Rankings and Team Sheets
« Reply #180 on: December 21, 2022, 08:46:24 AM »
Big East NET rankings as of games of December 20, 2022
New Old
1   1   UConn   
36   28   Marquette   
37   36   Xavier
51   47   Creighton   
58   58   Butler   
74   73   St. John's
79   86   Providence   
90   94   Seton Hall   
105   100   Villanova   
181   176   DePaul   
224   247   Georgetown   

December 21 Team Sheets . MU is 36
https://www.warrennolan.com/basketball/2023/net-teamsheets-plus
The only mystery in life is why the Kamikaze Pilots wore helmets...
            ---Al McGuire

DoctorV

  • All American
  • *****
  • Posts: 2569
Re: Big East Poll , NET Rankings and Team Sheets
« Reply #181 on: December 21, 2022, 08:52:23 AM »
Big East NET rankings as of games of December 20, 2022
New Old
1   1   UConn   
36   28   Marquette   
37   36   Xavier
51   47   Creighton   
58   58   Butler   
74   73   St. John's
79   86   Providence   
90   94   Seton Hall   
105   100   Villanova   
181   176   DePaul   
224   247   Georgetown   

December 21 Team Sheets . MU is 36
https://www.warrennolan.com/basketball/2023/net-teamsheets-plus

Biggest problem with this years installment of the BE numbers wise-

A close loss on the road to a good BE team will drop you 6-8 spots in NET. Of course it wouldn’t be as drastic later in the season, but the StJ, Providence, SH, Nova numbers are so low that it affects you more negatively than it should.

Imagine losing to one of them in a blowout.

Conversely, it’s becoming evident that outside of beating UConn those teams not only need to continue to win, but they will need to win some games against good teams very convincingly

Newsdreams

  • All American
  • *****
  • Posts: 9574
  • Goal - Win BE
Re: Big East Poll , NET Rankings and Team Sheets
« Reply #182 on: December 21, 2022, 05:00:55 PM »
Biggest problem with this years installment of the BE numbers wise-

A close loss on the road to a good BE team will drop you 6-8 spots in NET. Of course it wouldn’t be as drastic later in the season, but the StJ, Providence, SH, Nova numbers are so low that it affects you more negatively than it should.

Imagine losing to one of them in a blowout.

Conversely, it’s becoming evident that outside of beating UConn those teams not only need to continue to win, but they will need to win some games against good teams very convincingly
Miss. ST. Losing to Drake didn't help.
Goal is National Championship

Uncle Rico

  • All American
  • *****
  • Posts: 10053
    • Mazos Hamburgers
Re: Big East Poll , NET Rankings and Team Sheets
« Reply #183 on: December 21, 2022, 05:28:48 PM »
Miss. ST. Losing to Drake didn't help.

That helps Bradley, though, and if it helps Bradley, it’ll make Brian Wardle that much better a candidate
Ramsey head thoroughly up his ass.

Herman Cain

  • All American
  • *****
  • Posts: 12897
  • 9-9-9
Re: Big East Poll , NET Rankings and Team Sheets
« Reply #184 on: December 22, 2022, 07:20:09 AM »
Big East NET rankings as of games of December 21, 2022
New Old
1   1   UConn
34   37   Xavier   
35   36   Marquette   
51   51   Creighton   
53   58   Butler   
76   79   Providence   
90   74   St. John's
93   90   Seton Hall   
97   105   Villanova   
179   181   DePaul   
228   224   Georgetown   

December 22 Team Sheets . MU is 35
https://www.warrennolan.com/basketball/2023/net-teamsheets-plus

The only mystery in life is why the Kamikaze Pilots wore helmets...
            ---Al McGuire

Herman Cain

  • All American
  • *****
  • Posts: 12897
  • 9-9-9
Re: Big East Poll , NET Rankings and Team Sheets
« Reply #185 on: December 23, 2022, 08:11:00 AM »
Big East NET rankings as of games of December 22, 2022
New Old
1   1   UConn   
33   34     Xavier
34   51   Creighton   
35   35   Marquette   
67   53   Butler   
76   76   Providence   
91   90   St. John's
94   93   Seton Hall   
98   97   Villanova   
176   179   DePaul   
229   228   Georgetown

December 23 Team Sheets . MU is 35

https://www.warrennolan.com/basketball/2023/net-teamsheets-plus

The only mystery in life is why the Kamikaze Pilots wore helmets...
            ---Al McGuire

Herman Cain

  • All American
  • *****
  • Posts: 12897
  • 9-9-9
Re: Big East Poll , NET Rankings and Team Sheets
« Reply #186 on: December 24, 2022, 11:57:17 AM »
Big East NET rankings as of games of December 23, 2022
New Old
1   1   UConn   
35   33   Xavier   
36   34   Creighton   
37   35   Marquette   
67   67   Butler   
75   76    Providence
90   91   St. John's
91   94   Seton Hall   
98   98   Villanova   
176   176   DePaul   
231   229   Georgetown   

December 24 Team Sheets . MU is 37
https://www.warrennolan.com/basketball/2023/net-teamsheets-plus
The only mystery in life is why the Kamikaze Pilots wore helmets...
            ---Al McGuire

Herman Cain

  • All American
  • *****
  • Posts: 12897
  • 9-9-9
Re: Big East Poll , NET Rankings and Team Sheets
« Reply #187 on: December 26, 2022, 07:03:15 AM »
Big East NET rankings as of games of December 25, 2022

New Old
1   1   UConn   
34   36   Creighton   
35   35   Xavier   
37   37   Marquette   
67   67   Butler   
75   75   Providence   
89   90   St. John's
91   91   Seton Hall   
98   98   Villanova
176   176   DePaul   
230   231   Georgetown   

December 26 Team Sheets . MU is 37

https://www.warrennolan.com/basketball/2023/net-teamsheets-plus


The only mystery in life is why the Kamikaze Pilots wore helmets...
            ---Al McGuire

mugrad_89

  • All American
  • *****
  • Posts: 1821
Re: Big East Poll , NET Rankings and Team Sheets
« Reply #188 on: December 26, 2022, 09:10:46 PM »
Big East NET rankings as of games of December 25, 2022

New Old
1   1   UConn   
34   36   Creighton   
35   35   Xavier   
37   37   Marquette   
67   67   Butler   
75   75   Providence   
89   90   St. John's
91   91   Seton Hall   
98   98   Villanova
176   176   DePaul   
230   231   Georgetown   

December 26 Team Sheets . MU is 37

https://www.warrennolan.com/basketball/2023/net-teamsheets-plus

I swear I’ll never understand NET - Creighton beats DePaul at home and moves up 2 spots?  😳

brewcity77

  • All American
  • *****
  • Posts: 26470
  • Warning-This poster may trigger thin skinned users
    • Cracked Sidewalks
Re: Big East Poll , NET Rankings and Team Sheets
« Reply #189 on: December 27, 2022, 11:52:27 AM »
I swear I’ll never understand NET - Creighton beats DePaul at home and moves up 2 spots?  😳

The metric likely expected Creighton to win by 10-12 points. They won by what, 15? Outperforming the metric will do that. Or it could be impacted by what happens to teams around them. Sometimes it's less a team moving up and more the teams around them moving down.
This space reserved for a 2024 2025 National Championship celebration banner.

Nukem2

  • Registered User
  • All American
  • *****
  • Posts: 4998
Re: Big East Poll , NET Rankings and Team Sheets
« Reply #190 on: December 27, 2022, 12:47:49 PM »
The metric likely expected Creighton to win by 10-12 points. They won by what, 15? Outperforming the metric will do that. Or it could be impacted by what happens to teams around them. Sometimes it's less a team moving up and more the teams around them moving down.
Most likely the metric factor as there were only a handful of games played on Christmas Day none of which would seem to have an impact on Creighton’s NET….

Herman Cain

  • All American
  • *****
  • Posts: 12897
  • 9-9-9
Re: Big East Poll , NET Rankings and Team Sheets
« Reply #191 on: December 27, 2022, 07:46:25 PM »
Big East Poll Rankings December 26,2022
AP
2.U Conn
22. X
Others receiving votes
MU, Cooley & Company

Coaches
2. U Conn
25. X
Others Receiving Votes
Cooley& Company, MU
The only mystery in life is why the Kamikaze Pilots wore helmets...
            ---Al McGuire

IrwinFletcher

  • Registered User
  • All American
  • *****
  • Posts: 701
Re: Big East Poll , NET Rankings and Team Sheets
« Reply #192 on: December 27, 2022, 09:34:46 PM »
Don't look now, but T-Rank has us in at #10.

5th best offense in the country.

rocky_warrior

  • Global Moderator
  • All American
  • *****
  • Posts: 9138
Re: Big East Poll , NET Rankings and Team Sheets
« Reply #193 on: December 27, 2022, 09:39:32 PM »
Don't look now, but T-Rank has us in at #10.

5th best offense in the country.

Kenpom is similar, at #8 offense, but then in conference only games, #5 in conference- hah.  Of course, Nova is #1 in conference only defensive efficiency, but I've heard they can't guard their own shadows :)

DoctorV

  • All American
  • *****
  • Posts: 2569
Re: Big East Poll , NET Rankings and Team Sheets
« Reply #194 on: December 27, 2022, 09:40:17 PM »
Don't look now, but T-Rank has us in at #10.

5th best offense in the country.

I get lost in all the ranking systems…

I know TRank is highly regarded, but is it one of those predictive types that projects forward sort of deal? I don’t think they make the actual committee teamsheets right? Just KPom, Sagarin, and one more (unless that’s TRank?)

jfp61

  • All American
  • *****
  • Posts: 1459
Re: Big East Poll , NET Rankings and Team Sheets
« Reply #195 on: December 27, 2022, 09:52:44 PM »
I get lost in all the ranking systems…

I know TRank is highly regarded, but is it one of those predictive types that projects forward sort of deal? I don’t think they make the actual committee teamsheets right? Just KPom, Sagarin, and one more (unless that’s TRank?)

Trank is a little offensive heavy, and favors the last 10 games more than the whole season. So basically it has this game and the baylor game weighed heavier. Not on committee sheets.

DoctorV

  • All American
  • *****
  • Posts: 2569
Re: Big East Poll , NET Rankings and Team Sheets
« Reply #196 on: December 27, 2022, 10:05:29 PM »
Big East NET rankings as of games of December 25, 2022

New Old
1   1   UConn   
34   36   Creighton   
35   35   Xavier   
37   37   Marquette   
67   67   Butler   
75   75   Providence   
89   90   St. John's
91   91   Seton Hall   
98   98   Villanova
176   176   DePaul   
230   231   Georgetown   

December 26 Team Sheets . MU is 37

https://www.warrennolan.com/basketball/2023/net-teamsheets-plus

I like this gap from Marquettes perspective from the top 4th to 5th in the BE.
MU should improve and pass up CU and XU.

Stay in that top 4 crunch of NET and become a lock.
Let the others fight for that one spot in a First 4 game in Dayton- I’ll say it’ll be between Providence, StJ and Nova to get themselves in position for that bid. I think Butler falls off with SH.

Herman Cain

  • All American
  • *****
  • Posts: 12897
  • 9-9-9
Re: Big East Poll , NET Rankings and Team Sheets
« Reply #197 on: December 28, 2022, 07:44:37 AM »
Big East NET rankings as of games of December 27,2002
New Old
1   1   UConn   
30   37   Marquette   
34   34   Creighton   
37   35   Xavier   
67   67   Butler   
75   75   Providence
89   89   St. John's
95   91   Seton Hall   
98   98   Villanova   
177   176   DePaul   
230   230   Georgetown   

December 28,2022 Team Sheets MU is 30

https://www.warrennolan.com/basketball/2023/net-teamsheets-plus

The only mystery in life is why the Kamikaze Pilots wore helmets...
            ---Al McGuire

lawdog77

  • All American
  • *****
  • Posts: 2544
Re: Big East Poll , NET Rankings and Team Sheets
« Reply #198 on: December 28, 2022, 08:16:21 AM »
Big East NET rankings as of games of December 27,2002
New Old
1   1   UConn   
30   37   Marquette   
34   34   Creighton   
37   35   Xavier   
67   67   Butler   
75   75   Providence
89   89   St. John's
95   91   Seton Hall   
98   98   Villanova   
177   176   DePaul   
230   230   Georgetown   

December 28,2022 Team Sheets MU is 30

https://www.warrennolan.com/basketball/2023/net-teamsheets-plus
And that's what double digit wins do for you. DONT PLAY THE WALKONS

TAMU, Knower of Ball

  • All American
  • *****
  • Posts: 22168
  • Meat Eater certified
Re: Big East Poll , NET Rankings and Team Sheets
« Reply #199 on: December 28, 2022, 10:30:14 AM »
Kenpom is similar, at #8 offense, but then in conference only games, #5 in conference- hah.  Of course, Nova is #1 in conference only defensive efficiency, but I've heard they can't guard their own shadows :)

Not sure if you are joking or not, but Villanova has only played 1 conference game and it was against the current 7th ranked offense in the conference. So their #1 conference rating is based on 1 good defensive game against a subpar (by BE standards) defense. If they maintain that ranking after UConn tonight, maybe you're on to something.
TAMU

I do know, Newsie is right on you knowing ball.