Main Menu
collapse

Resources

2024-2025 SOTG Tally


2024-25 Season SoG Tally
Jones, K.10
Mitchell6
Joplin4
Ross2
Gold1

'23-24 '22-23
'21-22 * '20-21 * '19-20
'18-19 * '17-18 * '16-17
'15-16 * '14-15 * '13-14
'12-13 * '11-12 * '10-11

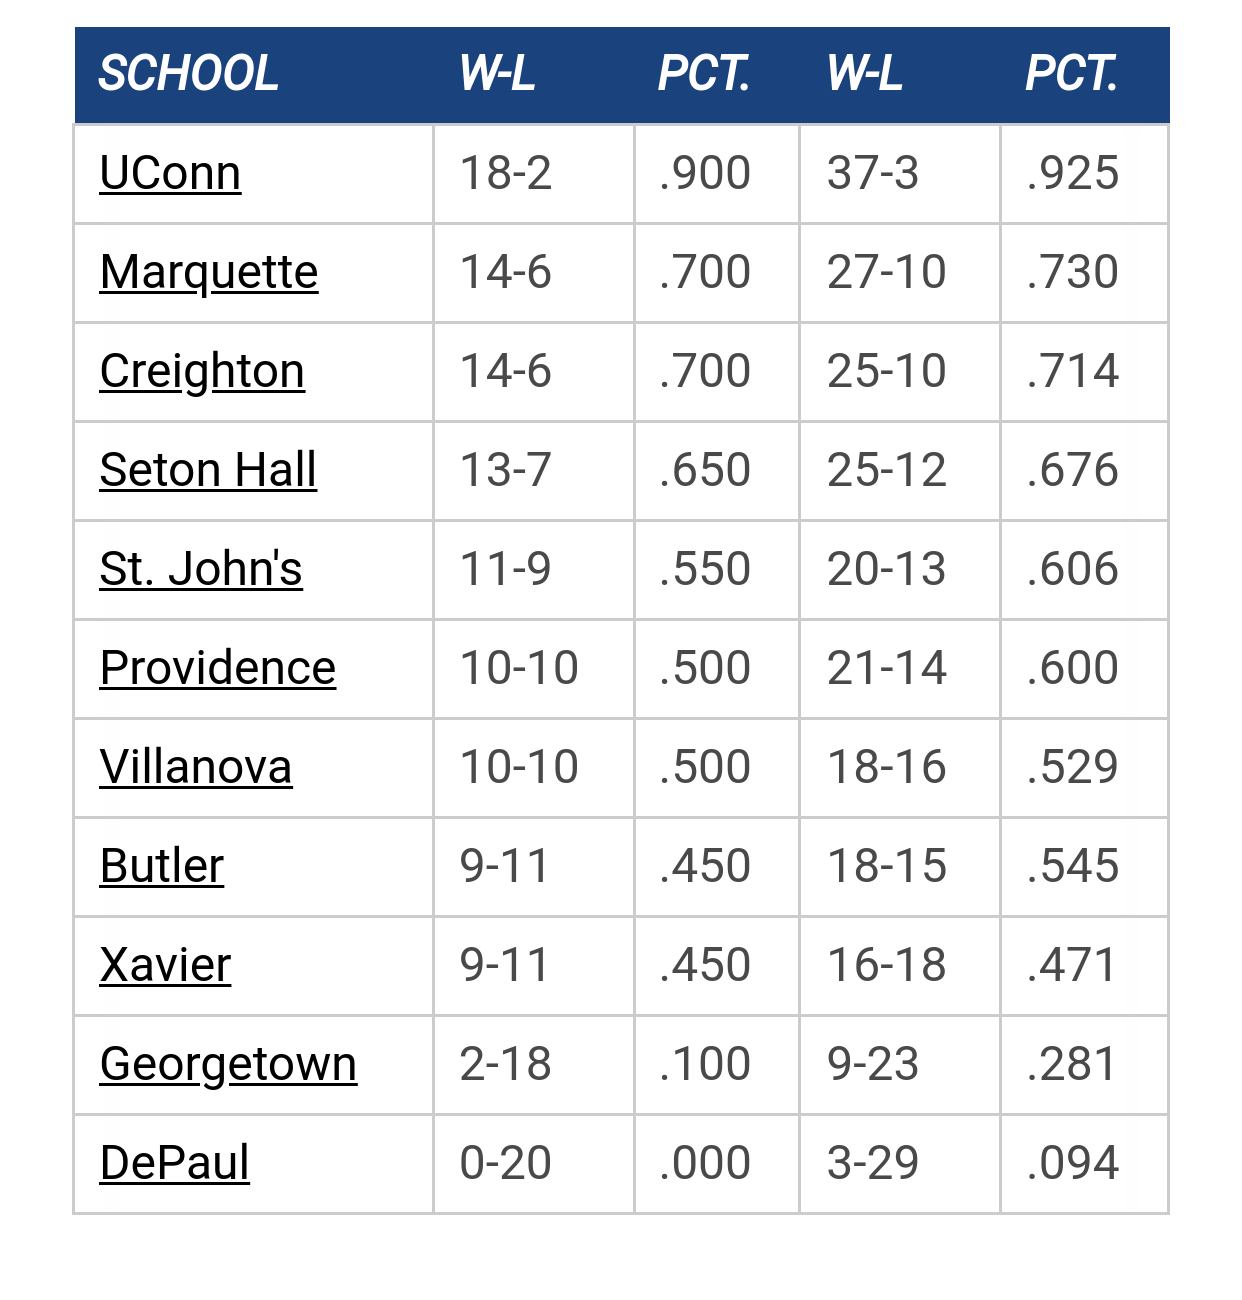
Big East Standings

Recent Posts

NIL Money by BCHoopster
[Today at 11:56:37 AM]


Recruiting as of 5/15/25 by MuMark
[Today at 11:47:00 AM]


Congrats to Royce by DoctorV
[May 24, 2025, 10:38:33 PM]


Let's talk about the roster/recruits w/Shaka by Jay Bee
[May 23, 2025, 08:31:14 PM]


Pearson to MU by Juan Anderson's Mixtape
[May 23, 2025, 08:12:08 PM]

Please Register - It's FREE!

The absolute only thing required for this FREE registration is a valid e-mail address. We keep all your information confidential and will NEVER give or sell it to anyone else.
Login to get rid of this box (and ads) , or signup NOW!

Next up: A long offseason

Marquette
66
Marquette
Scrimmage
Date/Time: Oct 4, 2025
TV: NA
Schedule for 2024-25
New Mexico
75

Newsdreams

Goal is National Championship
CBP profile my people who landed here over 100 yrs before Mayflower. Most I've had to deal with are ignorant & low IQ.
Can't believe we're living in the land of F 452/1984/Animal Farm/Brave New World/Handmaid's Tale. When travel to Mars begins, expect Starship Troopers

vogue65

Quote from: brewcity77 on January 13, 2021, 04:19:40 PM
In order...

Your past isn't really relevant. What's relevant is how you behave when numbers come out. You constantly question the numbers, but never bother doing the research to determine what the number presented to you actually mean. You complain about them without understanding their context. To me, that's just lazy. And when given explanations, you just spin away from it and try to fight the match harder. Seems like it's just trolling, but that you are now starting threads about it without bothering to read the research that's been done already, that's just lazy.

Why do you believe the PC line was far off? A three-point line is right between 1 & 2 possessions. In the final 18:03 of the game, it was a two-possession game for 13:16. So for 73.5% of the last 18 minutes, the line was pretty much right on. I guess the line was "so far off" because Marquette made 4 free throws in the final minute.

The book balancing the bets? No. The line wasn't off.

No. Again, the line wasn't off.

Sign up for kenpom and read all his blog posts. Sign up for The Athletic and read all the work they do on analytics. Research Torvik, Haslam, and all the various bracketologists. From a Marquette perspective, become familiar with Paint Touches, Anonymous Eagle, Cracked Sidewalks, and The Golden Breakdown. And if you "have seen and worked with more numbers" than I can imagine, why not do the research yourself? Create your own home court (or home cooking, if you'd rather) metric and go on a game-by-game basis through all 345 active programs and share your results.

Or just make do with what others here are happy to share.

You would be surprised how delusional people become using numbers for decision making.
In basketball, in particular, the numbers I see are ridiculous.
Entertaining, interesting, profitable, but foolish.

For example, is learning curve technology included in the so-called algorithms?
I have seen tremendous improvement in our freshmen, where well they be next week, or at game 20?
How much impact does travel, rest time, home cooking have on results?  If they have impact, are they in the numbers? It is easy to bandy about numbers, even with a lot of number crunching, and still be far from reality.


brewcity77

So no actual substance. Par for the course.

BallBoy

Quote from: vogue65 on January 13, 2021, 01:35:41 PM
That's the point.  Where is the home court advantage?  Is it in the audience?
Where our home court losses a freshman team vs. a more experienced team? 

The confusion is one situation Providence vs.  M.U. vs. a larger sample. 
The M.U. home losses is a larger, but still small sample.
Nationally we have a larger sample with many details we don't know.

I feel after reading this you are really just arguing that the home court aka the floor itself doesn't provide an advantage.  If Marquette were to move away from a hard maple to an oak floor we could get a Home Court advantage because your other logic makes zero sense. 

vogue65

Quote from: brewcity77 on January 13, 2021, 04:19:40 PM
In order...

Your past isn't really relevant. What's relevant is how you behave when numbers come out. You constantly question the numbers, but never bother doing the research to determine what the number presented to you actually mean. You complain about them without understanding their context. To me, that's just lazy. And when given explanations, you just spin away from it and try to fight the match harder. Seems like it's just trolling, but that you are now starting threads about it without bothering to read the research that's been done already, that's just lazy.

Why do you believe the PC line was far off? A three-point line is right between 1 & 2 possessions. In the final 18:03 of the game, it was a two-possession game for 13:16. So for 73.5% of the last 18 minutes, the line was pretty much right on. I guess the line was "so far off" because Marquette made 4 free throws in the final minute.

The book balancing the bets? No. The line wasn't off.

No. Again, the line wasn't off.

Sign up for kenpom and read all his blog posts. Sign up for The Athletic and read all the work they do on analytics. Research Torvik, Haslam, and all the various bracketologists. From a Marquette perspective, become familiar with Paint Touches, Anonymous Eagle, Cracked Sidewalks, and The Golden Breakdown. And if you "have seen and worked with more numbers" than I can imagine, why not do the research yourself? Create your own home court (or home cooking, if you'd rather) metric and go on a game-by-game basis through all 345 active programs and share your results.

Or just make do with what others here are happy to share.

Because I'm retired and lazy. 
Because I was asked about my personal relationship with numbers, analytics, modelling, mathematics, etc..

If you like reading reams of so-called statistics that's fine by me.
We have had discussions here about small sample size, that is fine by me as well.
No need to analyze 345 active programs.
Weighted averages and factors would come into play, but that is besides our point.
I would rather analyze one game at a time.
What I'm saying is that number crunching does not answer the question I'm asking. 
61% vs. 56% of home court wins may be true, but so what.
Why the difference is the question.
Are there any assunptions in the numbers and if so what are they?
Probably none because we just have very raw data.
Is any consideration given to the number of days between games?
If not then we are dealing with true but rather meaningless numbers.
Well, not meaningless to those who subscribe to the service or use the numbers to write stories.
The numbers are just meaningless to old fools like me.
Using the past to forecast the future outcome of events is really a fools errand.
When I was in Milwaukee I knew guys who lost their entire tuition thinking they had a system.
Might have something to do with my attitude toward modeling.

I don't mean to be mean, but what others are willing to share by others who sell numbers is of no interest to me.  To each his own, enjoy.   You win, you and the rest of the MUScoop team can play with the numbers you have. 

I'll just keep wondering what travel, prep. time, and home cooking have on outcomes vs. home vs. away results.

Love, V65


YaBlueIt

People are way overthinking this. It's obviously a combination of a bunch of factors, including travel, sleep, practice, and yes, fans.

Unless someone can point to another major difference between other years and this one that can account for a lesser winning % of home teams, then fans do make a difference, even if a small one. If anything, the fact that home teams still have an advantage this year validates the the other benefits of playing at home, instead of invalidating the advantage of fans.

Usually most obvious answer is the right one.

vogue65

Quote from: YaBlueIt on January 14, 2021, 12:53:03 PM
People are way overthinking this. It's obviously a combination of a bunch of factors, including travel, sleep, practice, and yes, fans.

Unless someone can point to another major difference between other years and this one that can account for a lesser winning % of home teams, then fans do make a difference, even if a small one. If anything, the fact that home teams still have an advantage this year validates the the other benefits of playing at home, instead of invalidating the advantage of fans.

Usually most obvious answer is the right one.

Very well said, and welcome aboard.
I agree with your view.
I don't think we overthink or over analyze, we over talk and tend to devolve into angry arguments.

Many people around here think that ratio analysis (percentages) is analytics and any mention of numbers is statistical rigor.  They are also impressed with sample size.  The data base rules while clear thing is lost.  Just because something is on a spreadsheet does not make it right, relevant, or a true algorithm that solves problems. 

The Providence game last week seemed to me an example, without the fans, of the travel factor in performance, what I call tired legs.  However, I don't have numbers to support my observation.   Therefore, many of my friends here discount my view out of hand.  We simply don't have the correlation analysis to prove either side. 

At the end of the day,  I love it when you said, "usually most obvious answer is the right one".  You sound like a medical doctor.

The last time I went to the track, probably 40 years ago, there were lots of tip sheets for sale.  The tipsters had dates, ages, weights, won lost records, times, jockeys, tracks, lots of history.  History, history, history and from that data they made predictions.  My friends wife would go to the paddock and bet on the horse with the bigest ass because she thought that a big ass would be a  good indicator of the stronger and therefore fastest horse.  My friend analyzed his three or four tip sheets.  I bet number 4, we all lost.

I put basketball numbercrunching services in the same category, to each his own.


hairy worthen

Quote from: vogue65 on January 15, 2021, 07:33:59 AM
Very well said, and welcome aboard.
I agree with your view.
I don't think we overthink or over analyze, we over talk and tend to devolve into angry arguments.

Many people around here think that ratio analysis (percentages) is analytics and any mention of numbers is statistical rigor.  They are also impressed with sample size.  The data base rules while clear thing is lost.  Just because something is on a spreadsheet does not make it right, relevant, or a true algorithm that solves problems. 

The Providence game last week seemed to me an example, without the fans, of the travel factor in performance, what I call tired legs.  However, I don't have numbers to support my observation.   Therefore, many of my friends here discount my view out of hand.  We simply don't have the correlation analysis to prove either side. 

At the end of the day,  I love it when you said, "usually most obvious answer is the right one".  You sound like a medical doctor.

The last time I went to the track, probably 40 years ago, there were lots of tip sheets for sale.  The tipsters had dates, ages, weights, won lost records, times, jockeys, tracks, lots of history.  History, history, history and from that data they made predictions.  My friends wife would go to the paddock and bet on the horse with the bigest ass because she thought that a big ass would be a  good indicator of the stronger and therefore fastest horse.  My friend analyzed his three or four tip sheets.  I bet number 4, we all lost.

I put basketball numbercrunching services in the same category, to each his own.

nm

The Sultan

Quote from: vogue65 on January 15, 2021, 07:33:59 AM
Very well said, and welcome aboard.
I agree with your view.
I don't think we overthink or over analyze, we over talk and tend to devolve into angry arguments.

Many people around here think that ratio analysis (percentages) is analytics and any mention of numbers is statistical rigor.  They are also impressed with sample size.  The data base rules while clear thing is lost.  Just because something is on a spreadsheet does not make it right, relevant, or a true algorithm that solves problems. 

The Providence game last week seemed to me an example, without the fans, of the travel factor in performance, what I call tired legs.  However, I don't have numbers to support my observation.   Therefore, many of my friends here discount my view out of hand.  We simply don't have the correlation analysis to prove either side.


This is very simple.  You stated an absolute position - that fans in the stands don't matter.  That the real advantage to the home team is the lack of travel.

Quote from: vogue65 on January 13, 2021, 12:49:43 PM
My takeaway from watching games this year is that the home audience does not matter.
I love going to games in person, rooting in person.

This year has been a test of teams, referees, the game itself without the distraction of the claims of home court advantage.  Home court advantage is a myth.  Home cooking is real, travel, and rest days are real.

No one countered your argument by saying "home cooking and rest days aren't real."  They countered it by showing that home court advantage means less this year, and the only factor that changed was that there was no fans in the stands.

I don't know if it "proves" anything, but it leads me to believe that fans in the stands are definitely a factor, and that your assertions that "the home audience does not matter" and "home court advantage is a myth" are inaccurate.
"I am one of those who think the best friend of a nation is he who most faithfully rebukes her for her sins—and he her worst enemy, who, under the specious and popular garb of patriotism, seeks to excuse, palliate, and defend them" - Frederick Douglass

ZiggysFryBoy

Quote from: vogue65 on January 15, 2021, 07:33:59 AM
Very well said, and welcome aboard.
I agree with your view.
I don't think we overthink or over analyze, we over talk and tend to devolve into angry arguments.

Many people around here think that ratio analysis (percentages) is analytics and any mention of numbers is statistical rigor.  They are also impressed with sample size.  The data base rules while clear thing is lost.  Just because something is on a spreadsheet does not make it right, relevant, or a true algorithm that solves problems. 

The Providence game last week seemed to me an example, without the fans, of the travel factor in performance, what I call tired legs.  However, I don't have numbers to support my observation.   Therefore, many of my friends here discount my view out of hand.  We simply don't have the correlation analysis to prove either side. 

At the end of the day,  I love it when you said, "usually most obvious answer is the right one".  You sound like a medical doctor.

The last time I went to the track, probably 40 years ago, there were lots of tip sheets for sale.  The tipsters had dates, ages, weights, won lost records, times, jockeys, tracks, lots of history.  History, history, history and from that data they made predictions.  My friends wife would go to the paddock and bet on the horse with the bigest ass because she thought that a big ass would be a  good indicator of the stronger and therefore fastest horse.  My friend analyzed his three or four tip sheets.  I bet number 4, we all lost.

I put basketball numbercrunching services in the same category, to each his own.

Everyone know to bet on the horse that takes the last pre-race sh!t.

mileskishnish72

When I saw the title of this thread, I thought it was about the officiating in Providence and Newark.

Good points re: OP, Brew.

BallBoy

In the latest Inside Marquette Basketball show with Wojo, the host stated that home wins are down 5% this year compared to last year.  The only difference is fans in the stands. Travel is the same, prep is the same, etc.

Depending on how the season ends, this could be a telling stat that fans impact 5% of home game which is approximately 1 game a year. You just don't know which one it will be so show up and scream your head off.


MUDPT

What's the old saying? Statistics charge, analytics indict and the tape convicts. Need everything.

Side note, brew do you actually use Haslem for anything?

Galway Eagle

So Vogue what's the deal? I was fully invested in your fresh legs theory
Retire Terry Rand's jersey!

JWags85

Quote from: Galway Eagle on January 23, 2021, 07:12:16 PM
So Vogue what's the deal? I was fully invested in your fresh legs theory

Hey, chill, any criticism of Wojo and the team is purely rooted in impatience and wanderlust and immaturity. Marquette needs to look long term with a rising star like Wojo. Patience!

Frenns Liquor Depot

Quote from: JWags85 on January 23, 2021, 07:22:04 PM
Hey, chill, any criticism of Wojo and the team is purely rooted in impatience and wanderlust and immaturity. Marquette needs to look long term with a rising star like Wojo. Patience!

Who could we possibly find to replace him.   There is no one!

vogue65

Quote from: Galway Eagle on January 23, 2021, 07:12:16 PM
So Vogue what's the deal? I was fully invested in your fresh legs theory

Ever eat possum stew?
It's like eating crow cacciatore.

I was totally invested in the downside of intetstate bus travel.

Previous topic - Next topic