collapse

* '23-'24 SOTG Tally


2023-24 Season SoG Tally
Kolek11
Ighodaro6
Jones, K.6
Mitchell2
Jones, S.1
Joplin1

'22-23
'21-22 * '20-21 * '19-20
'18-19 * '17-18 * '16-17
'15-16 * '14-15 * '13-14
'12-13 * '11-12 * '10-11

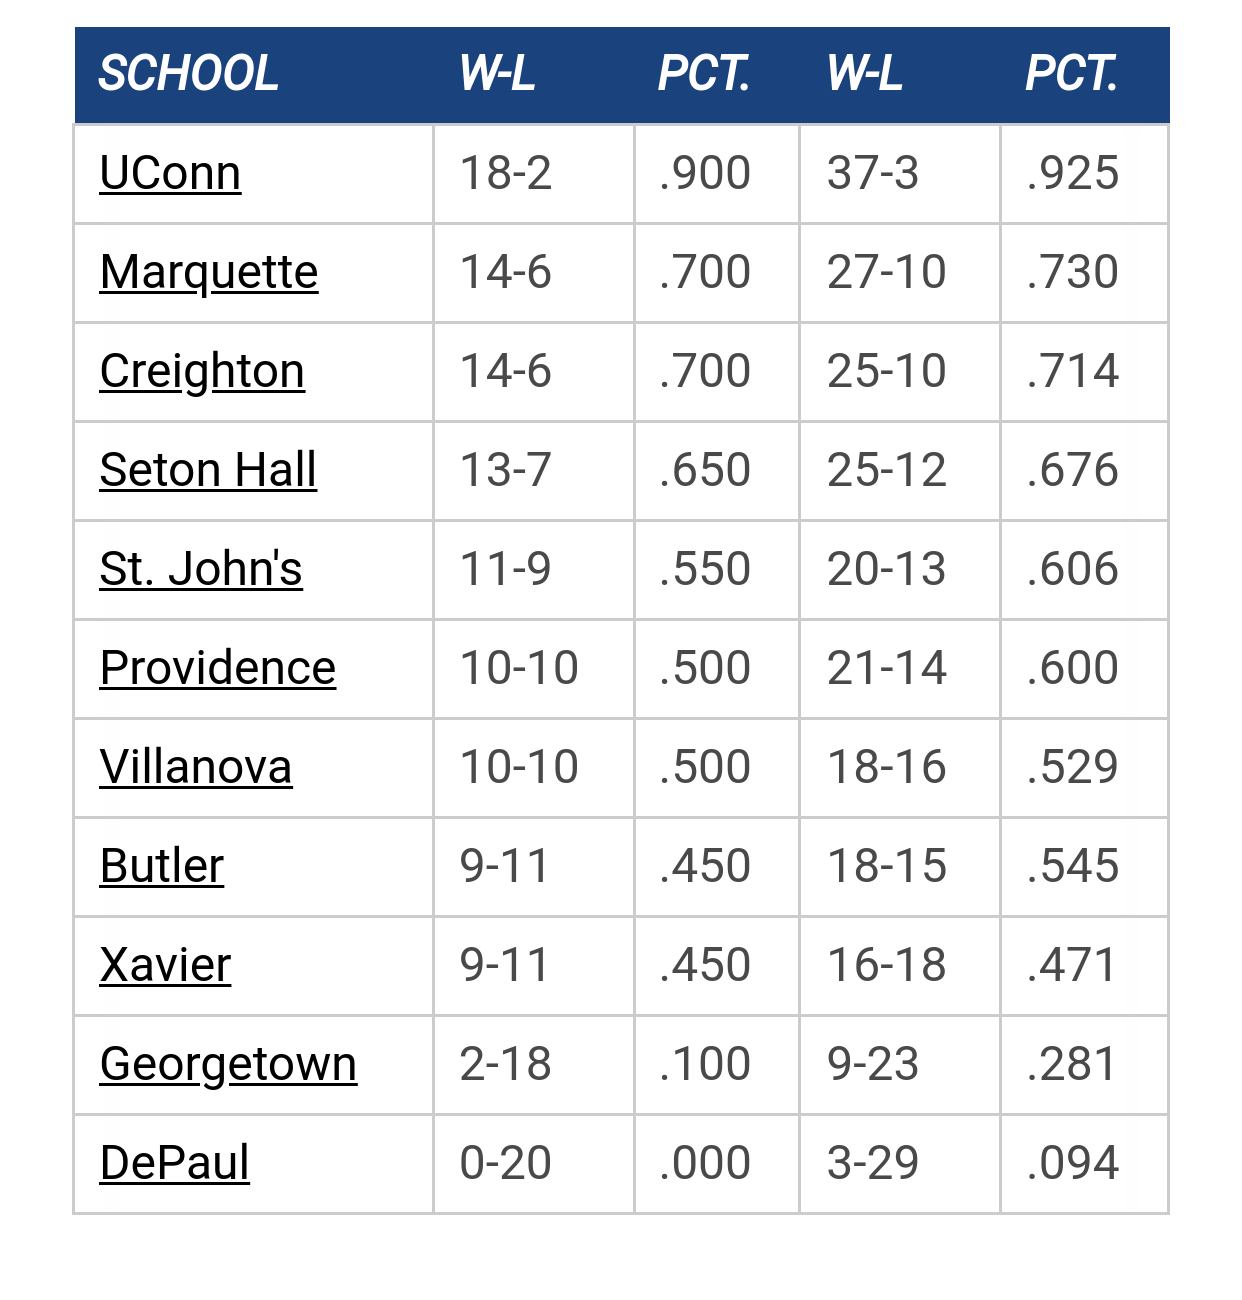
* Big East Standings

Please Register - It's FREE!

The absolute only thing required for this FREE registration is a valid e-mail address.  We keep all your information confidential and will NEVER give or sell it to anyone else.
Login to get rid of this box (and ads) , or register NOW!

* Next up: The long cold summer

Marquette
Marquette

Open Practice

Date/Time: Oct 11, 2024 ???
TV: NA
Schedule for 2023-24
27-10

Author Topic: After feedback from 100+ Athletic Departments, Here Are the Updated Ratings  (Read 8395 times)

auburnmarquette

  • Team Captain
  • ****
  • Posts: 434
    • Value Add Explaination
http://www.crackedsidewalks.com/2018/06/after-feedback-from-100-athletic.html

One fear in the offseason Value Add team rankings is that Big East teams would rate too high because the MUScoop community does an even better job of pointing out missing players from our teams than from others. 

To that end, thanks to my secret weapon Molly Pudner, a data and information whiz, who contacted all 351 D1 basketball Athletic Departments this month and received updates from more than 100 regarding their rosters. These are now all reflected in the google sheet, and hopefully will soon be current on www.valueaddbasketball.com. Molly (who also did my big data projects in my campaign days and whose brother did all the research for my Marquette book before going on to program cell towers across the country) also picked up on some things I had missed - such as Jay Bilas excellent rating of the best on-ball defenders (see subhead The Bilastrator's 30 best in-your-grill defenders). On-ball defense is the biggest item that Value Add cannot end, Ever since I watched Dominic Wright (then Dominic James) play lock down in your grill defense to force what registered as steals for other MU players I wished their was a way to get a separate evaluation of on-ball defense - so maybe I will do something with it.

The good news is that even with a ton of updates that moved some other teams around, the Big East teams were only passed by a few other teams. In fact, one non-Big East Athletic Director pointed out a transfer to Butler that we did not have in the system which help Butler right on the bubble at 51st.

Here are the updated team rankings, and neither St. John's or Marquette changed since the June 8 update, with St. John's maintaining the smallest edge of 0.12 points for the 2nd place in the Big East. Here are all the Big East teams and the Top 50. (like many of you, I actually was able to focus more on baseball the last few weeks while Molly collected the data, and had two baseball preview posts reach 80,000+ https://www.facebook.com/valueaddsports/)


Rank   Team   Value Add   Big East Changes
11   Villanova   38.51   Same spot
23   St. John's   33.25   dropped 1 spot
24   Marquette   33.13   dropped 1 spot
29   Providence   32.44   Dropped 2 spots
51   Butler   27.6   Same spot
67   Xavier   24.57   Dropped 2 spots
73   Georgetown   23.11   Dropped 2 spots
81   Creighton   22.35   dropped 4 spots
94   DePaul   21.15   dropped 4 spots
103   Seton Hall   20.36   dropped 6 spots
1   Nevada   51.85   
2   Duke   46.65   
3   Kentucky   45.33   
4   Kansas   42.29   
5   Oregon   41.52   
6   Tennessee   40.6   
7   North Carolina   40.31   
8   Mississippi St.   40.05   
9   LSU   39.18   
10   Auburn   38.66   
12   Gonzaga   37.94   
13   Syracuse   37.44   
14   UCLA   36.17   
15   Miami FL   35.60   
16   South Dakota St.   35.12   
17   North Carolina St.   35.07   
18   Indiana   34.95   
19   Virginia   34.62   
20   Texas   34.28   
21   Michigan St.   33.63   
22   Virginia Tech   33.49   
25   Montana   32.93   
26   Maryland   32.77   
27   Florida   32.73   
28   Iowa   32.49   
30   Kansas St.   32.39   
31   Arizona St.   32.1   
32   Alabama   32.09   
33   San Diego St.   31.84   
34   Clemson   31.56   
35   USC   31.41   
36   Wisconsin   30.75   
37   TCU   30.21   
38   Iowa St.   29.83   
39   Washington   29.81   
40   Northeastern   29.61   
41   Nebraska   29.49   
42   Notre Dame   29.38   
43   Northwestern   29.3   
44   Western Kentucky   29.22   
45   Texas Tech   29.21   
46   Ohio St.   28.95   
47   Michigan   28.48   
48   West Virginia   28.29   
49   Florida St.   28.25   
50   Penn St.   28.22   
« Last Edit: June 30, 2018, 01:25:52 AM by auburnmarquette »
http://www.pudnersports.com/ for my blogs or articles and www.valueaddbasketball.com for for current and historic rankings.

D'Lo Brown

  • All American
  • *****
  • Posts: 506
http://www.crackedsidewalks.com/2018/06/after-feedback-from-100-athletic.html

One fear in the offseason Value Add team rankings is that Big East teams would rate too high because the MUScoop community does an even better job of pointing out missing players from our teams than from others. 

To that end, thanks to my secret weapon Molly Pudner, a data and information whiz, who contacted all 351 D1 basketball Athletic Departments this month and received updates from more than 100 regarding their rosters. These are now all reflected in the google sheet, and hopefully will soon be current on www.valueaddbasketball.com. Molly (who also did my big data projects in my campaign days and whose brother did all the research for my Marquette book before going on to program cell towers across the country) also picked up on some things I had missed - such as Jay Bilas excellent rating of the best on-ball defenders (see subhead The Bilastrator's 30 best in-your-grill defenders). On-ball defense is the biggest item that Value Add cannot end, Ever since I watched Dominic Wright (then Dominic James) play lock down in your grill defense to force what registered as steals for other MU players I wished their was a way to get a separate evaluation of on-ball defense - so maybe I will do something with it.

The good news is that even with a ton of updates that moved some other teams around, the Big East teams were only passed by a few other teams. In fact, one non-Big East Athletic Director pointed out a transfer to Butler that we did not have in the system which help Butler right on the bubble at 51st.

Here are the updated team rankings, and neither St. John's or Marquette changed since the June 8 update, with St. John's maintaining the smallest edge of 0.12 points for the 2nd place in the Big East. Here are all the Big East teams and the Top 50. (like many of you, I actually was able to focus more on baseball the last few weeks while Molly collected the data, and had two baseball preview posts reach 80,000+ https://www.facebook.com/valueaddsports/)


Rank   Team   Value Add   Big East Changes
11   Villanova   38.51   Same spot
23   St. John's   33.25   dropped 1 spot
24   Marquette   33.13   dropped 1 spot
29   Providence   32.44   Dropped 2 spots
51   Butler   27.6   Same spot
67   Xavier   24.57   Dropped 2 spots
73   Georgetown   23.11   Dropped 2 spots
81   Creighton   22.35   dropped 4 spots
94   DePaul   21.15   dropped 4 spots
103   Seton Hall   20.36   dropped 6 spots
1   Nevada   51.85   
2   Duke   46.65   
3   Kentucky   45.33   
4   Kansas   42.29   
5   Oregon   41.52   
6   Tennessee   40.6   
7   North Carolina   40.31   
8   Mississippi St.   40.05   
9   LSU   39.18   
10   Auburn   38.66   
12   Gonzaga   37.94   
13   Syracuse   37.44   
14   UCLA   36.17   
15   Miami FL   35.60   
16   South Dakota St.   35.12   
17   North Carolina St.   35.07   
18   Indiana   34.95   
19   Virginia   34.62   
20   Texas   34.28   
21   Michigan St.   33.63   
22   Virginia Tech   33.49   
25   Montana   32.93   
26   Maryland   32.77   
27   Florida   32.73   
28   Iowa   32.49   
30   Kansas St.   32.39   
31   Arizona St.   32.1   
32   Alabama   32.09   
33   San Diego St.   31.84   
34   Clemson   31.56   
35   USC   31.41   
36   Wisconsin   30.75   
37   TCU   30.21   
38   Iowa St.   29.83   
39   Washington   29.81   
40   Northeastern   29.61   
41   Nebraska   29.49   
42   Notre Dame   29.38   
43   Northwestern   29.3   
44   Western Kentucky   29.22   
45   Texas Tech   29.21   
46   Ohio St.   28.95   
47   Michigan   28.48   
48   West Virginia   28.29   
49   Florida St.   28.25   
50   Penn St.   28.22

DePaul not predicted in the cellar.

Also predicted in top 100.

Discuss.

Herman Cain

  • All American
  • *****
  • Posts: 12919
  • 9-9-9
http://www.crackedsidewalks.com/2018/06/after-feedback-from-100-athletic.html

One fear in the offseason Value Add team rankings is that Big East teams would rate too high because the MUScoop community does an even better job of pointing out missing players from our teams than from others. 

To that end, thanks to my secret weapon Molly Pudner, a data and information whiz, who contacted all 351 D1 basketball Athletic Departments this month and received updates from more than 100 regarding their rosters. These are now all reflected in the google sheet, and hopefully will soon be current on www.valueaddbasketball.com. Molly (who also did my big data projects in my campaign days and whose brother did all the research for my Marquette book before going on to program cell towers across the country) also picked up on some things I had missed - such as Jay Bilas excellent rating of the best on-ball defenders (see subhead The Bilastrator's 30 best in-your-grill defenders). On-ball defense is the biggest item that Value Add cannot end, Ever since I watched Dominic Wright (then Dominic James) play lock down in your grill defense to force what registered as steals for other MU players I wished their was a way to get a separate evaluation of on-ball defense - so maybe I will do something with it.

The good news is that even with a ton of updates that moved some other teams around, the Big East teams were only passed by a few other teams. In fact, one non-Big East Athletic Director pointed out a transfer to Butler that we did not have in the system which help Butler right on the bubble at 51st.

Here are the updated team rankings, and neither St. John's or Marquette changed since the June 8 update, with St. John's maintaining the smallest edge of 0.12 points for the 2nd place in the Big East. Here are all the Big East teams and the Top 50. (like many of you, I actually was able to focus more on baseball the last few weeks while Molly collected the data, and had two baseball preview posts reach 80,000+ https://www.facebook.com/valueaddsports/)


Rank   Team   Value Add   Big East Changes
11   Villanova   38.51   Same spot
23   St. John's   33.25   dropped 1 spot
24   Marquette   33.13   dropped 1 spot
29   Providence   32.44   Dropped 2 spots
51   Butler   27.6   Same spot
67   Xavier   24.57   Dropped 2 spots
73   Georgetown   23.11   Dropped 2 spots
81   Creighton   22.35   dropped 4 spots
94   DePaul   21.15   dropped 4 spots
103   Seton Hall   20.36   dropped 6 spots
1   Nevada   51.85   
2   Duke   46.65   
3   Kentucky   45.33   
4   Kansas   42.29   
5   Oregon   41.52   
6   Tennessee   40.6   
7   North Carolina   40.31   
8   Mississippi St.   40.05   
9   LSU   39.18   
10   Auburn   38.66   
12   Gonzaga   37.94   
13   Syracuse   37.44   
14   UCLA   36.17   
15   Miami FL   35.60   
16   South Dakota St.   35.12   
17   North Carolina St.   35.07   
18   Indiana   34.95   
19   Virginia   34.62   
20   Texas   34.28   
21   Michigan St.   33.63   
22   Virginia Tech   33.49   
25   Montana   32.93   
26   Maryland   32.77   
27   Florida   32.73   
28   Iowa   32.49   
30   Kansas St.   32.39   
31   Arizona St.   32.1   
32   Alabama   32.09   
33   San Diego St.   31.84   
34   Clemson   31.56   
35   USC   31.41   
36   Wisconsin   30.75   
37   TCU   30.21   
38   Iowa St.   29.83   
39   Washington   29.81   
40   Northeastern   29.61   
41   Nebraska   29.49   
42   Notre Dame   29.38   
43   Northwestern   29.3   
44   Western Kentucky   29.22   
45   Texas Tech   29.21   
46   Ohio St.   28.95   
47   Michigan   28.48   
48   West Virginia   28.29   
49   Florida St.   28.25   
50   Penn St.   28.22
You continue to have Quincy McKnight at Seton Hall very under ranked. Also he is a junior not a sophomore. For example you have him rated much lower than Kostas who is not even going to be in college basketball any more.

The only mystery in life is why the Kamikaze Pilots wore helmets...
            ---Al McGuire

PBRme

  • All American
  • *****
  • Posts: 529
Markus almost in the top 100 lock down defenders (104) seems a couple hundred too high
Peace, Love, and Rye Whiskey...May your life and your glass always be full

TAMU, Knower of Ball

  • All American
  • *****
  • Posts: 22199
  • Meat Eater certified
DePaul not predicted in the cellar.

Also predicted in top 100.

Discuss.

DePaul finished in the top 100 of KenPom last season.
TAMU

I do know, Newsie is right on you knowing ball.


GooooMarquette

  • All American
  • *****
  • Posts: 9489
  • We got this.
DePaul finished in the top 100 of KenPom last season.


At DePaul, two straight years in the top 100 just might get ‘em to hang a banner.

auburnmarquette

  • Team Captain
  • ****
  • Posts: 434
    • Value Add Explaination
Markus almost in the top 100 lock down defenders (104) seems a couple hundred too high

Actually the 104th ranking is his overall ranking among returning players. The system ranks him as a terrible defender at +0.36, meaning his defense actually gives up more points than a borderline replacement player. His offense is elite, so even with poor defense he is a potential top 100 player overall, but definitely not in the top 1000 defenders last year.
http://www.pudnersports.com/ for my blogs or articles and www.valueaddbasketball.com for for current and historic rankings.

auburnmarquette

  • Team Captain
  • ****
  • Posts: 434
    • Value Add Explaination
You continue to have Quincy McKnight at Seton Hall very under ranked. Also he is a junior not a sophomore. For example you have him rated much lower than Kostas who is not even going to be in college basketball any more.

Quincy was a terrible player at Sacred Heart. He played against awful teams one of the weakest conferences in the country in the nec and even against them his shooting was well below average both on 2-pointers ( 45%) and 3-pointere (32%). The thing he did do a ton of is turn the ball over, probably one of the highest few totals in the game since he kept the ball a ton and his turnover percentage at kenpom was over 23%.

He may be the greatest player in the world at Seton Hall, but a guy who was a terrible shooter and constantly giving the ball to the other team despite playing against terrible teams is not going to project as a great player prior to his return.

http://www.pudnersports.com/ for my blogs or articles and www.valueaddbasketball.com for for current and historic rankings.

MU82

  • All American
  • *****
  • Posts: 22979
http://www.crackedsidewalks.com/2018/06/after-feedback-from-100-athletic.html

One fear in the offseason Value Add team rankings is that Big East teams would rate too high because the MUScoop community does an even better job of pointing out missing players from our teams than from others. 

To that end, thanks to my secret weapon Molly Pudner, a data and information whiz, who contacted all 351 D1 basketball Athletic Departments this month and received updates from more than 100 regarding their rosters. These are now all reflected in the google sheet, and hopefully will soon be current on www.valueaddbasketball.com. Molly (who also did my big data projects in my campaign days and whose brother did all the research for my Marquette book before going on to program cell towers across the country) also picked up on some things I had missed - such as Jay Bilas excellent rating of the best on-ball defenders (see subhead The Bilastrator's 30 best in-your-grill defenders). On-ball defense is the biggest item that Value Add cannot end, Ever since I watched Dominic Wright (then Dominic James) play lock down in your grill defense to force what registered as steals for other MU players I wished their was a way to get a separate evaluation of on-ball defense - so maybe I will do something with it.

The good news is that even with a ton of updates that moved some other teams around, the Big East teams were only passed by a few other teams. In fact, one non-Big East Athletic Director pointed out a transfer to Butler that we did not have in the system which help Butler right on the bubble at 51st.

Here are the updated team rankings, and neither St. John's or Marquette changed since the June 8 update, with St. John's maintaining the smallest edge of 0.12 points for the 2nd place in the Big East. Here are all the Big East teams and the Top 50. (like many of you, I actually was able to focus more on baseball the last few weeks while Molly collected the data, and had two baseball preview posts reach 80,000+ https://www.facebook.com/valueaddsports/)


Rank   Team   Value Add   Big East Changes
11   Villanova   38.51   Same spot
23   St. John's   33.25   dropped 1 spot
24   Marquette   33.13   dropped 1 spot
29   Providence   32.44   Dropped 2 spots
51   Butler   27.6   Same spot
67   Xavier   24.57   Dropped 2 spots
73   Georgetown   23.11   Dropped 2 spots
81   Creighton   22.35   dropped 4 spots
94   DePaul   21.15   dropped 4 spots
103   Seton Hall   20.36   dropped 6 spots
1   Nevada   51.85   
2   Duke   46.65   
3   Kentucky   45.33   
4   Kansas   42.29   
5   Oregon   41.52   
6   Tennessee   40.6   
7   North Carolina   40.31   
8   Mississippi St.   40.05   
9   LSU   39.18   
10   Auburn   38.66   
12   Gonzaga   37.94   
13   Syracuse   37.44   
14   UCLA   36.17   
15   Miami FL   35.60   
16   South Dakota St.   35.12   
17   North Carolina St.   35.07   
18   Indiana   34.95   
19   Virginia   34.62   
20   Texas   34.28   
21   Michigan St.   33.63   
22   Virginia Tech   33.49   
25   Montana   32.93   
26   Maryland   32.77   
27   Florida   32.73   
28   Iowa   32.49   
30   Kansas St.   32.39   
31   Arizona St.   32.1   
32   Alabama   32.09   
33   San Diego St.   31.84   
34   Clemson   31.56   
35   USC   31.41   
36   Wisconsin   30.75   
37   TCU   30.21   
38   Iowa St.   29.83   
39   Washington   29.81   
40   Northeastern   29.61   
41   Nebraska   29.49   
42   Notre Dame   29.38   
43   Northwestern   29.3   
44   Western Kentucky   29.22   
45   Texas Tech   29.21   
46   Ohio St.   28.95   
47   Michigan   28.48   
48   West Virginia   28.29   
49   Florida St.   28.25   
50   Penn St.   28.22

For those of us who aren't all that familiar with Value Add, what is this saying about Nevada?

That they are predicted to do better than every other team in the country?

What does team Value Add measure?
“It’s not how white men fight.” - Tucker Carlson

Jay Bee

  • All American
  • *****
  • Posts: 9084
For those of us who aren't all that familiar with Value Add, what is this saying about Nevada?

That they are predicted to do better than every other team in the country?

What does team Value Add measure?

I think this might be a danger of using Value Add to rank teams... but auburn could explain how we should think of it.. to me, Nevada has tons of guys who are very good... but the reality is that they all can't play big minutes... lots of newcomers... so, their Value Add is inflated in a way that doesn't make sense if you're trying to project teams as to how good they will be... true?

It's almost if you need a minutes projection adjustment to really use it in some cases.. now, Nevada is a unique roster.. very very unique.
Thanks for ruining summer, Canada.

brewcity77

  • All American
  • *****
  • Posts: 26507
  • Warning-This poster may trigger thin skinned users
    • Cracked Sidewalks
Nevada is a top-10 team in most rankings. I still don't get the St John's ranking. There is absolutely zero reason to think Mustapha Heron will be eligible.
This space reserved for a 2024 2025 National Championship celebration banner.

Jay Bee

  • All American
  • *****
  • Posts: 9084
Nevada is a top-10 team in most rankings. I still don't get the St John's ranking. There is absolutely zero reason to think Mustapha Heron will be eligible.

Nevada: No problems with them in the top 10, but they are #1 by a significant margin in Value Add... will be interesting to see MPG for those guys this season.

St. John's: True - there's no reason to have Heron included as he's not eligible to play. If that extreme longshot occurs, then great.. but, just not likely.
Thanks for ruining summer, Canada.

brewcity77

  • All American
  • *****
  • Posts: 26507
  • Warning-This poster may trigger thin skinned users
    • Cracked Sidewalks
Nevada: No problems with them in the top 10, but they are #1 by a significant margin in Value Add... will be interesting to see MPG for those guys this season.

St. John's: True - there's no reason to have Heron included as he's not eligible to play. If that extreme longshot occurs, then great.. but, just not likely.

I'm with you on Nevada. As mentioned, tons of talent but still only 200 minutes per game. Just saying that them being highly ranked isn't out of the ordinary this year.
This space reserved for a 2024 2025 National Championship celebration banner.

TheGym

  • Registered User
  • Starter
  • ***
  • Posts: 234
I'm with you on Nevada. As mentioned, tons of talent but still only 200 minutes per game. Just saying that them being highly ranked isn't out of the ordinary this year.

10% better than the next best team makes me question the entire calculation

Silkk the Shaka

  • All American
  • *****
  • Posts: 5378
Looks like the database shows Reid Travis as available, but he committed to Kentucky recently. With a projected VA of 8.54, that puts Kentucky at #1 right? Or am I thinking about it wrong?

Herman Cain

  • All American
  • *****
  • Posts: 12919
  • 9-9-9
Quincy was a terrible player at Sacred Heart. He played against awful teams one of the weakest conferences in the country in the nec and even against them his shooting was well below average both on 2-pointers ( 45%) and 3-pointere (32%). The thing he did do a ton of is turn the ball over, probably one of the highest few totals in the game since he kept the ball a ton and his turnover percentage at kenpom was over 23%.

He may be the greatest player in the world at Seton Hall, but a guy who was a terrible shooter and constantly giving the ball to the other team despite playing against terrible teams is not going to project as a great player prior to his return.
What was Derrick Wilson's value add going into Senior Year? Just curious to see.
The only mystery in life is why the Kamikaze Pilots wore helmets...
            ---Al McGuire

Juan Anderson's Mixtape

  • All American
  • *****
  • Posts: 4384
10% better than the next best team makes me question the entire calculation

Not how it works.  Auburn can explain it better than I can but a team value add of 50 is not twice as good as team with a value add of 25.

TAMU, Knower of Ball

  • All American
  • *****
  • Posts: 22199
  • Meat Eater certified
What was Derrick Wilson's value add going into Senior Year? Just curious to see.

You can look that up on valueaddbasketball.com. Going into his senior year his value add was 1.18.
« Last Edit: July 02, 2018, 04:36:07 PM by TAMU Eagle »
TAMU

I do know, Newsie is right on you knowing ball.


MU82

  • All American
  • *****
  • Posts: 22979
I think this might be a danger of using Value Add to rank teams... but auburn could explain how we should think of it.. to me, Nevada has tons of guys who are very good... but the reality is that they all can't play big minutes... lots of newcomers... so, their Value Add is inflated in a way that doesn't make sense if you're trying to project teams as to how good they will be... true?

It's almost if you need a minutes projection adjustment to really use it in some cases.. now, Nevada is a unique roster.. very very unique.

Nevada is a top-10 team in most rankings. I still don't get the St John's ranking. There is absolutely zero reason to think Mustapha Heron will be eligible.

Nevada: No problems with them in the top 10, but they are #1 by a significant margin in Value Add... will be interesting to see MPG for those guys this season.

St. John's: True - there's no reason to have Heron included as he's not eligible to play. If that extreme longshot occurs, then great.. but, just not likely.

I'm with you on Nevada. As mentioned, tons of talent but still only 200 minutes per game. Just saying that them being highly ranked isn't out of the ordinary this year.

10% better than the next best team makes me question the entire calculation

Good discussion, folks. Thanks. I'd be interested in hearing auburn's take.
“It’s not how white men fight.” - Tucker Carlson

TAMU, Knower of Ball

  • All American
  • *****
  • Posts: 22199
  • Meat Eater certified
You can look that up on valueaddbasketball.com. Going into his senior year his value add was 1.18.

Out of curiosity I looked up the top value add players in Marquette's history (data goes back to 2002). What do people think of this list?

1. 2012 Jae Crowder
2. 2003 Dwyane Wade
3. 2004 Travis Diener
4. 2005 Travis Diener
5. 2010 Jimmy Butler
6. 2002 Dwyane Wade
7. 2006 Steve Novak
8. 2010 Lazar Hayward
9. 2018 Andrew Rowsey
10. 2011 Jimmy Butler
11. 2018 Sam Hauser
12. 2009 Wesley Matthews
13. 2013 Davante Gardner
14. 2011 Jae Crowder
15. 2003 Travis Diener
16. 2003 Robert Jackson
17. 2006 Dominic James
18. 2002 Cordell Henry
19. 2009 Jerel McNeal
20. 2008 Jerel McNeal
21. 2009 Lazar Hayward
22. 2008 Dominic James
23. 2012 Darius Johnson-Odom
24. 2010 Mo Acker
T-25. 2018 Markus Howard
T-25. 2002 Travis Diener

I think my only surprises on that list is that 2003 Wade isn't #1 and I was expecting a lot more of the three amigos towards the top. Also, all four of Diener's seasons made the top 25, what a stud.
« Last Edit: July 02, 2018, 04:44:24 PM by TAMU Eagle »
TAMU

I do know, Newsie is right on you knowing ball.


GGGG

  • All American
  • *****
  • Posts: 25207
Out of curiosity I looked up the top value add players in Marquette's history (data goes back to 2002). What do people think of this list?

1. 2012 Jae Crowder
2. 2003 Dwyane Wade
3. 2004 Travis Diener
4. 2005 Travis Diener
5. 2010 Jimmy Butler
6. 2002 Dwyane Wade
7. 2006 Steve Novak
8. 2010 Lazar Hayward
9. 2018 Andrew Rowsey
10. 2011 Jimmy Butler
11. 2018 Sam Hauser
12. 2009 Wesley Matthews
13. 2013 Davante Gardner
14. 2011 Jae Crowder
15. 2003 Travis Diner
16. 2003 Robert Jackson
17. 2006 Dominic James
18. 2002 Cordell Henry
19. 2009 Jerel McNeal
20. 2008 Jerel McNeal
21. 2009 Lazar Hayward
22. 2008 Dominic James
23. 2012 Darius Johnson-Odom
24. 2010 Mo Acker
25. 2018 Markus Howard

I think my only surprises on that list is that 2003 Wade isn't #1 and I was expecting a lot more of the three amigos towards the top.

It should tell you how good Jae actually was that year.

brewcity77

  • All American
  • *****
  • Posts: 26507
  • Warning-This poster may trigger thin skinned users
    • Cracked Sidewalks
10% better than the next best team makes me question the entire calculation

It's a bit of a flaw in the system, but it's because Nevada is a really weird case. They return 4 starters and their top two bench players. They add 5 transfers that averaged between 13 and 20 ppg at their last stops as well as a McDonald's All-American freshman.

Basically, they have 12 guys that on paper are huge impact guys. Any of those guys, if they played 30 mpg, would likely be big-time Value Add players. The system analyzes them based on their past production, but what it doesn't take into account is those 12 guys will have to share 200 minutes. The Martin twins and Caroline are going to probably average 30 mpg. That leaves 110 minutes to divvy up between 9 players.

Guys like Nisre Zouzoua (20.3 ppg at Bryant in 35.5 mpg), Jazz Johnson (15.8 ppg at Portland in 35.1 mpg), Corey Henson (14.6 ppg at Wagner in 33.9 mpg), Tre'shawn Thurman (13.8 ppg at Omaha in 29.8 mpg), and Trey Porter (13.2 ppg at Old Dominion in 23.6 mpg) get big Value Add numbers because of how productive they were with starter minutes. But there will be guys there likely getting 10-15 mpg. Their Value Adds will drop as their minutes (and thus productivity) drop.

Nevada is so deep that grad transfer Ehab Amin, a grad transfer that averaged 16.9 ppg last year, transferred to Nevada and left once the Martin twins came back because they didn't have enough scholarships for him (he's now projected to start for top-25 Oregon).

But that's the flaw. Nevada is ridiculously deep with proven players whose Value Adds won't drop until the minutes start to shake out in November and beyond. Don't scrap the entire system just because a team found a loophole that overrates them in the system. It's similar to how Pomeroy's system overrated Wisconsin annually. He acknowledged the flaw, as I'm sure auburn would here, but that doesn't mean the entire system is broken.
This space reserved for a 2024 2025 National Championship celebration banner.

Herman Cain

  • All American
  • *****
  • Posts: 12919
  • 9-9-9
You can look that up on valueaddbasketball.com. Going into his senior year his value add was 1.18.
Thank You.
The only mystery in life is why the Kamikaze Pilots wore helmets...
            ---Al McGuire

Herman Cain

  • All American
  • *****
  • Posts: 12919
  • 9-9-9
http://www.crackedsidewalks.com/2018/06/after-feedback-from-100-athletic.html

One fear in the offseason Value Add team rankings is that Big East teams would rate too high because the MUScoop community does an even better job of pointing out missing players from our teams than from others. 

To that end, thanks to my secret weapon Molly Pudner, a data and information whiz, who contacted all 351 D1 basketball Athletic Departments this month and received updates from more than 100 regarding their rosters. These are now all reflected in the google sheet, and hopefully will soon be current on www.valueaddbasketball.com. Molly (who also did my big data projects in my campaign days and whose brother did all the research for my Marquette book before going on to program cell towers across the country) also picked up on some things I had missed - such as Jay Bilas excellent rating of the best on-ball defenders (see subhead The Bilastrator's 30 best in-your-grill defenders). On-ball defense is the biggest item that Value Add cannot end, Ever since I watched Dominic Wright (then Dominic James) play lock down in your grill defense to force what registered as steals for other MU players I wished their was a way to get a separate evaluation of on-ball defense - so maybe I will do something with it.

The good news is that even with a ton of updates that moved some other teams around, the Big East teams were only passed by a few other teams. In fact, one non-Big East Athletic Director pointed out a transfer to Butler that we did not have in the system which help Butler right on the bubble at 51st.

Here are the updated team rankings, and neither St. John's or Marquette changed since the June 8 update, with St. John's maintaining the smallest edge of 0.12 points for the 2nd place in the Big East. Here are all the Big East teams and the Top 50. (like many of you, I actually was able to focus more on baseball the last few weeks while Molly collected the data, and had two baseball preview posts reach 80,000+ https://www.facebook.com/valueaddsports/)


Rank   Team   Value Add   Big East Changes
11   Villanova   38.51   Same spot
23   St. John's   33.25   dropped 1 spot
24   Marquette   33.13   dropped 1 spot
29   Providence   32.44   Dropped 2 spots
51   Butler   27.6   Same spot
67   Xavier   24.57   Dropped 2 spots
73   Georgetown   23.11   Dropped 2 spots
81   Creighton   22.35   dropped 4 spots
94   DePaul   21.15   dropped 4 spots
103   Seton Hall   20.36   dropped 6 spots
1   Nevada   51.85   
2   Duke   46.65   
3   Kentucky   45.33   
4   Kansas   42.29   
5   Oregon   41.52   
6   Tennessee   40.6   
7   North Carolina   40.31   
8   Mississippi St.   40.05   
9   LSU   39.18   
10   Auburn   38.66   
12   Gonzaga   37.94   
13   Syracuse   37.44   
14   UCLA   36.17   
15   Miami FL   35.60   
16   South Dakota St.   35.12   
17   North Carolina St.   35.07   
18   Indiana   34.95   
19   Virginia   34.62   
20   Texas   34.28   
21   Michigan St.   33.63   
22   Virginia Tech   33.49   
25   Montana   32.93   
26   Maryland   32.77   
27   Florida   32.73   
28   Iowa   32.49   
30   Kansas St.   32.39   
31   Arizona St.   32.1   
32   Alabama   32.09   
33   San Diego St.   31.84   
34   Clemson   31.56   
35   USC   31.41   
36   Wisconsin   30.75   
37   TCU   30.21   
38   Iowa St.   29.83   
39   Washington   29.81   
40   Northeastern   29.61   
41   Nebraska   29.49   
42   Notre Dame   29.38   
43   Northwestern   29.3   
44   Western Kentucky   29.22   
45   Texas Tech   29.21   
46   Ohio St.   28.95   
47   Michigan   28.48   
48   West Virginia   28.29   
49   Florida St.   28.25   
50   Penn St.   28.22
I think LJ Figueroa of St Johns needs to be reviewed. He was a top 100 recruit and then had a juco year were he performed well. I assume the Juco statistics were not readily available?
The only mystery in life is why the Kamikaze Pilots wore helmets...
            ---Al McGuire

TheGym

  • Registered User
  • Starter
  • ***
  • Posts: 234
It's a bit of a flaw in the system, but it's because Nevada is a really weird case. They return 4 starters and their top two bench players. They add 5 transfers that averaged between 13 and 20 ppg at their last stops as well as a McDonald's All-American freshman.

Basically, they have 12 guys that on paper are huge impact guys. Any of those guys, if they played 30 mpg, would likely be big-time Value Add players. The system analyzes them based on their past production, but what it doesn't take into account is those 12 guys will have to share 200 minutes. The Martin twins and Caroline are going to probably average 30 mpg. That leaves 110 minutes to divvy up between 9 players.

Guys like Nisre Zouzoua (20.3 ppg at Bryant in 35.5 mpg), Jazz Johnson (15.8 ppg at Portland in 35.1 mpg), Corey Henson (14.6 ppg at Wagner in 33.9 mpg), Tre'shawn Thurman (13.8 ppg at Omaha in 29.8 mpg), and Trey Porter (13.2 ppg at Old Dominion in 23.6 mpg) get big Value Add numbers because of how productive they were with starter minutes. But there will be guys there likely getting 10-15 mpg. Their Value Adds will drop as their minutes (and thus productivity) drop.

Nevada is so deep that grad transfer Ehab Amin, a grad transfer that averaged 16.9 ppg last year, transferred to Nevada and left once the Martin twins came back because they didn't have enough scholarships for him (he's now projected to start for top-25 Oregon).

But that's the flaw. Nevada is ridiculously deep with proven players whose Value Adds won't drop until the minutes start to shake out in November and beyond. Don't scrap the entire system just because a team found a loophole that overrates them in the system. It's similar to how Pomeroy's system overrated Wisconsin annually. He acknowledged the flaw, as I'm sure auburn would here, but that doesn't mean the entire system is broken.

Thanks for the explanation and I understand the limitations of the aggregation statistics.  Similar to WAR in baseball, they aggregate a bunch of stats to get to one number.  There are always anomalies with these calcs.  Especially when they try and layer in defensive stats. 

Admittedly, I am not a big fan of these aggregation stats including WAR in baseball. However, they definitely make for interesting discussions.


feedback