collapse

Resources

2024-2025 SOTG Tally


2024-25 Season SoG Tally
Jones, K.10
Mitchell6
Joplin4
Ross2
Gold1

'23-24 '22-23
'21-22 * '20-21 * '19-20
'18-19 * '17-18 * '16-17
'15-16 * '14-15 * '13-14
'12-13 * '11-12 * '10-11

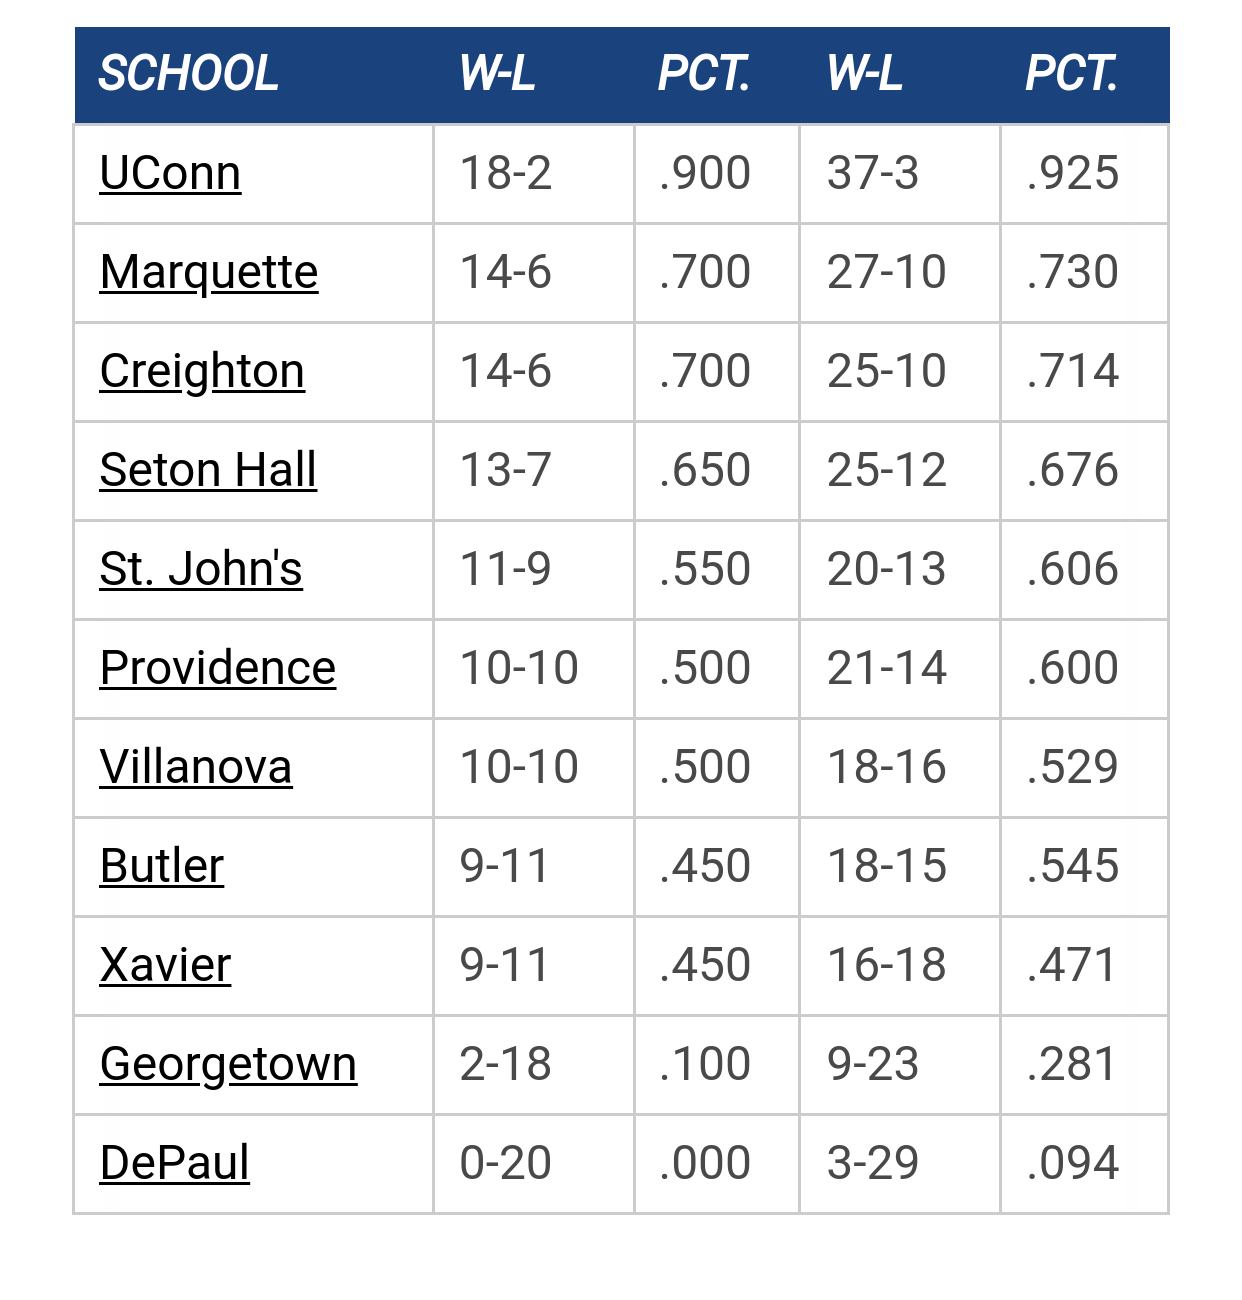
Big East Standings

Recent Posts

What is the actual gap between Marquette and the top of the Big East by Uncle Rico
[Today at 05:24:56 PM]


NM by mu_hilltopper
[Today at 03:51:26 PM]


Recruiting as of 5/15/25 by MuMark
[Today at 03:40:00 PM]


Psyched about the future of Marquette hoops by Vander Blue Man Group
[Today at 02:11:01 PM]


2026 Bracketology by Vander Blue Man Group
[Today at 10:16:30 AM]


Marquette NBA Thread by 1SE
[May 16, 2025, 10:45:38 PM]


2025 Transfer Portal by TSmith34, Inc.
[May 16, 2025, 08:26:40 PM]

Please Register - It's FREE!

The absolute only thing required for this FREE registration is a valid e-mail address. We keep all your information confidential and will NEVER give or sell it to anyone else.
Login to get rid of this box (and ads) , or signup NOW!

Next up: A long offseason

Marquette
66
Marquette
Scrimmage
Date/Time: Oct 4, 2025
TV: NA
Schedule for 2024-25
New Mexico
75

CrackedSidewalks

Value Add 3.0 Introduction; 4 1/2 Years After Value Add Introduction

It is amazing how much has changed in college basketball since I introduced Value Add basketball in May 2011. Kris Dunn's was really hoping Marquette would sign him, nine other teams were in the Big East, and teams were scoring under 67 points a game (this year 72 a game).

Value Add 2.0 was necessitated three years later due to some peer criticisms and scoring exploding from 1.004 to 1.043 points per trip due to freedom of movement rules. Today Value Add 3.0 is introduced to pinpoint even more accurately each players offensive and defensive value to his team.

I realize the exhaustive detail of how every action a player takes impacts the team's score is too technical to be of interest to most readers, so the rest of you may want to scroll to the bottom for the rankings of all Big East players through Providence hard-fought loss against Michigan State the evening of November 29, 2015. The database will updated soon with the new system once the programmers are done, but as of this writing the only current Value Add 3.0 valuations are for the Big East players below.

Overview

Value Add 1.0 Overview: Anthony Davis added 7.29% to Kentucky’s scoring with his offense, and took away -5.06% from opponent’s scoring in the first season after the introduction of the system, so his total impact on the score was 12.35%, the highest Value Add in the country. Value Add 1.0 therefore calculated that if Kentucky would have lost a game 69-70 with a typical fourth or fifth man off the bench playing instead of Davis, then with Davis they win 74-66.
Version 2.0 Overview: As we tested the system we found we were under valuing players and it appeared the actual figure was close to the POINTS rather than the PERCENT OF POINTS added by a player.
Version 3.0 Overview: For various reasons, it became important to set the level of the "replacement player" lower - thus meaning we assumed a player further down the bench. Therefore a solid mid-major/high-major starter (pegged as the 100th best player at either SG, SF, PF or C) is now likely worth about 4.0 rather than 3.0 points per game and a player would need to be higher than 10.0 Value Add to be a candidate for an All-American team. The fact that the best teams in the country now calculate as close to 50 points better than the worst teams is consistent with other team calculations.

1st of 3 Components - Offense
Value Add 1.0 Offense. The Offensive component was first explained in this post, as we can measure with great precision how many points a player ad to his team’s score. Perhaps the most important breakthrough of this system was that the level of every defense faced is measured, so a player must put up much better stats against a mediocre team than a top-level team to get the same stats. 
Value Add 2.0 Offense. This was thThe other benefit of this system is that it led to a pretty reliable projection tool as players' main improvement came between their freshman and sophomore seasons.
Value Add 3.0 Offense. The main offensive adjustment increases the value rating, but as we continue to look for small tweaks in measuring the value of each stat in an era of increased freedom of movement and a 30-second shot clock Value Add 3.0 also added a control factor so that if the sum of a team's players is dramatically above or below the team value at www.kenpom.com, then each players offensive value add is scaled to correct the discrepancy. 

2nd of 3 Components - Defense
Value Add 1.0 Defense. The Defensive component is not quite as precise, but even some in the analytics arena admit to me that noone else matches the measurement of the impact of a college player's defense better than Value Add. This system measures a player’s ability to block shots, steal the ball, grab defensive rebounds - all of which goes into other systems. HOWEVER, the key component is it measures every trip down the court and what percent of the trips result in a basket or miss when there is no blocked shot or steal.
Value Add 2.0 Defense. Two adjustments were necessary to the defensive rating. First, I had assumed a player who had a lot of steals also tended to force more turnovers in addition to those steals, and in studying the last few years this does NOT appear to be the case. Secondly, the system was built assuming scoring would always be very close to 1.00 points per trip, and when scoring exploded to 1.04 in 2014 as suddenly the vast majority of players with a lot of minutes looked like bad defenders. We "patched" this system in 2.0 on the fly in 2014.

Value Add 3.0 Defense. Now the defensive adjustment has been adjusted so that a decent defensive player in any season will be 1.5 points a game better on defense than a replacement player no matter how many points are being score per trip or in the average game.

3rd of 3 Components - Position Adjustment
Value Add 1.0 Position. The original Point Guard/Perimeter Defensive Rating (PG/Per) redistributed a small percent of the credit from post players who do not turn the ball over as much because they do not have to dribble as often and who grab more defensive rebounds because they do not have to play defense on the perimeter.  I wrote that after extensive study, this figure was determined the most accurate way to fairly adjust ratings based on position, as explained in this post.

Value Add 2.0 Position. And the bottom line is that the peer review on this system was terrible. Others in the analytical arena hated this approach as a way to throw subjective evaluations into what was otherwise an objective system worthy of serious consideration. While I would still like to reward a player like UVa's Malcolm Brogdon extra credit for the subjective evaluations of him running the team on offense and defense, it was just a non-starter. Therefore we changed the system to simply adjust the final rating so that the 100th best player at each position would be worth 3.0 points per game and the average point guard 3.5.

Value Add 3.0 Position. We did modify further - still based on the top 100 players at each of the five positions - so that the 100th best at each position will usually be around a 4.0 Value Add and the average point guard at 4.5 Value Add. Point guards usually are more valuable - and it is because they must run the show. However, as rules were changed to allow more and more freedom of movement, the overall stat productivity moved from the front line (you needed to lob it inside once physically manhandled at the perimeter a few years ago but now you can drive by them). But this is all relative - if your opponents are now getting a lot more from their guards and you are only getting a little more, then your guards are far less valuable.

Critics of 1.0 Please Take a Look at 3.0; Thanks to Existing Fans
First and foremost, I hope those who really liked the system except for the PG/Per factor or some other specific criticism - thank you for the constructive criticism and I hope you will look at the new ratings as we update them.
I want to thank those NBA officials who met with me to talk about the NBA Indicators developed in conjunction with Rob Lowe, particularly those who asked me to explain why the numbers showed Jimmy Butler and Jae Crowder would be so good at the NBA-level prior to those drafts. 
I must thank Sports IllustratedESPNNBC Sports and especially Fox Sports for their praise of the system as well as all of the other outlets who have covered Value Add.  
In addition, thanks to school sites (e.g. Kentucky,ArizonaNC StateBaylor) and League sites for the Big Ten, Summit, Horizon and Patriot Leagues for their coverage, and the many Sports Athletic Departments who email and offer corrections on rosters. It is hard to track 4,000+ players a year!

Top 100 Big East Players through Sunday

For those of you who skipped the technical stuff to skip to here ...

Kris Dunn easily tops the list in the Big East with a value of 12.70 points per game over a borderline substitute, but you can also see why Villanova is the favorite with the next three spots. One apology I may owe - Ryan Arcidiacano. I scoffed at him being named co-Big East Player of the Year with Dunn last year. While I stand by Dunn being clearly the best player in the conference, Arcidiacono does rank well ahead of Georgetown's D'Vauntes Smith-Rivera so far - partly due to Smith-Rivera's three-point shooting and offensive rating being much lower than the last two years in early going but partly due to the new system showing Ryan was better than I thought.

RnkBE Players through SunTeamHtYrOffDefPosVANBA?
1D
Source: Value Add 3.0 Introduction; 4 1/2 Years After Value Add Introduction

Previous topic - Next topic