collapse

Resources

2024-2025 SOTG Tally


2024-25 Season SoG Tally
Jones, K.10
Mitchell6
Joplin4
Ross2
Gold1

'23-24 '22-23
'21-22 * '20-21 * '19-20
'18-19 * '17-18 * '16-17
'15-16 * '14-15 * '13-14
'12-13 * '11-12 * '10-11

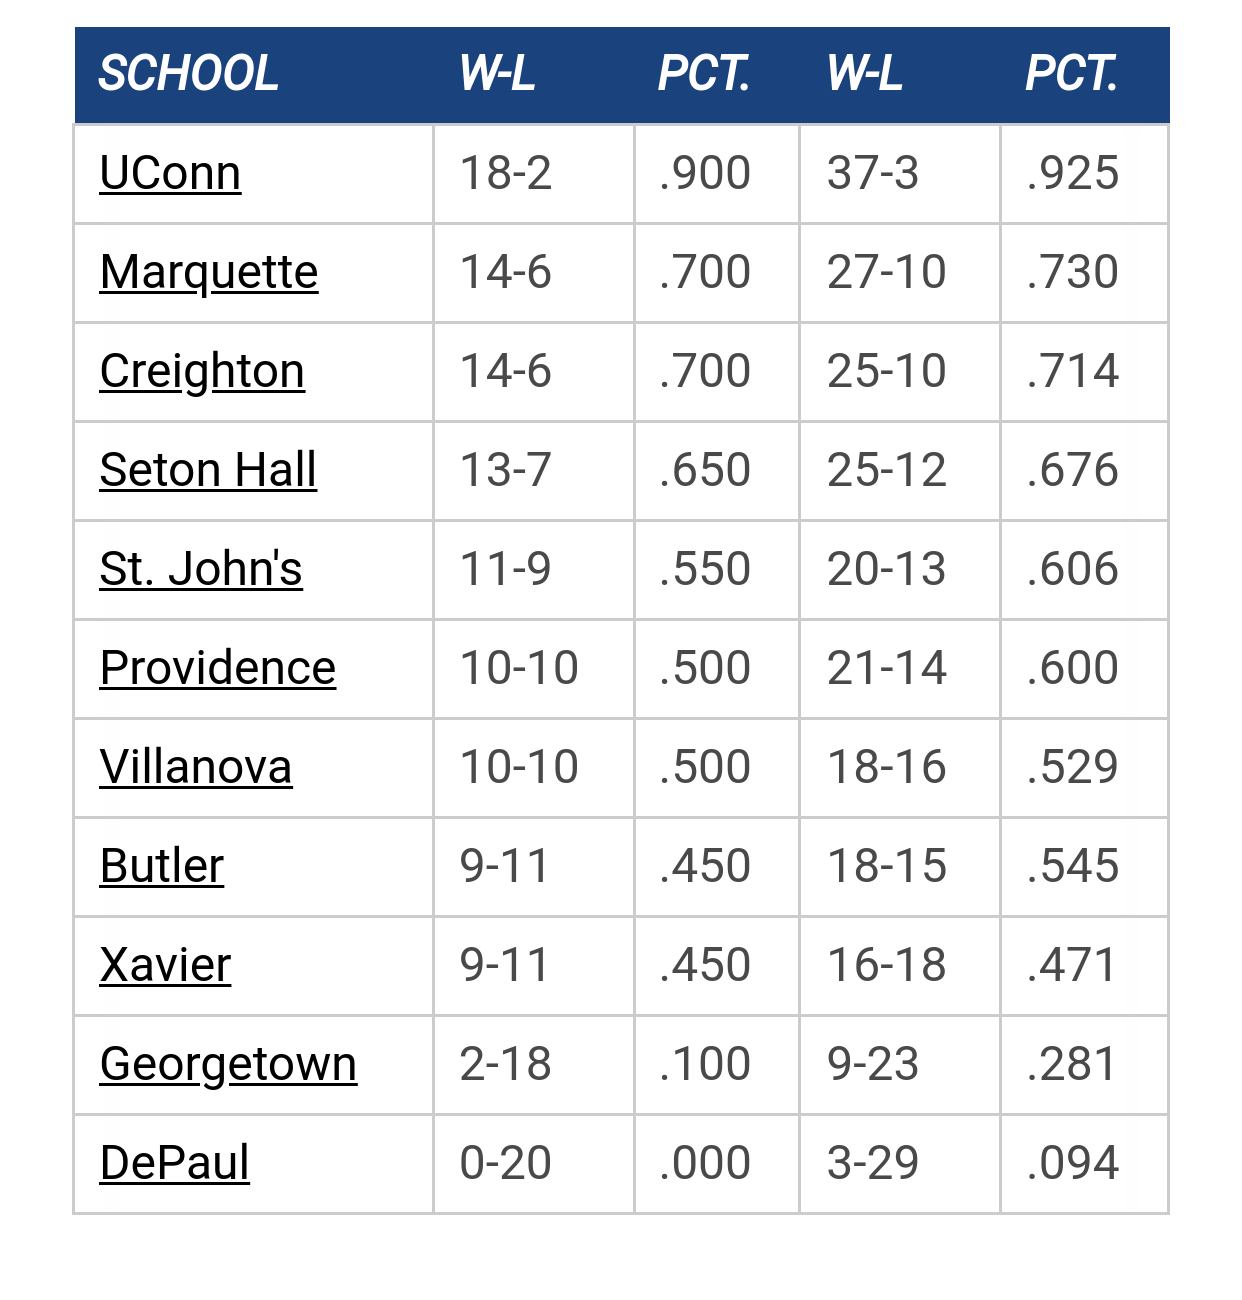
Big East Standings

Please Register - It's FREE!

The absolute only thing required for this FREE registration is a valid e-mail address. We keep all your information confidential and will NEVER give or sell it to anyone else.
Login to get rid of this box (and ads) , or signup NOW!

Next up: A long offseason

Marquette
66
Marquette
Scrimmage
Date/Time: Oct 4, 2025
TV: NA
Schedule for 2024-25
New Mexico
75

BenCat12

Quote from: ChicosBailBonds on March 20, 2014, 10:42:37 PM
>:(
>:(+1.......I'm going to pass out if I hold my breath much longer.....

The Equalizer

Quote from: Jay Bee on March 20, 2014, 10:26:29 PM
Equalizer - I replied to someone asking "how were we only 160 in 2012."

My answer was that we played more games than others and went on to say looking at 3fga/fga would make some sense, but your rankings were stupid.

No need to change the subject. Just admit it or shut it.

First, your answer to the question is wrong.   

We played the same number of games in 2009 as we did in 2012 but ranked 63rd with 664 3pt attempts
We played the same number of games in 2013 as we did in 2012 but ranked 309th with 497 3pt attempts

Therefore, saying we ranked 160th becuase "we played more games" is wrong. 

Next, there is nothing inherently "stupid" about using the number of 3 point shot attempts (and 3 point makes) to show the multi-year decline in 3 point shooting by Marquette.  You're basing that on the false premise that tempo and number of games played had any sort of significant impact.  They don't.  They are noise, not signal.

I already showed that the number of games in 2009 and 2013 wer ethe same. If we look at tempo, in 2009, we had 65.3 possesions per 40 minutes.  In 2013 we had 64.3--nearly identical tempo, exact same number of games.  Yet that one psession per game doesn't come close to explaining the 167 fewer 3 point attempts. 

Finally, we can look at 3 point field goal point percentage--that's a stat independent of tempo or number of games played--just a flat measure of what percenage of a team's points came from 3 pointers.

2009 28.0% - rank of 190th nationally.
2010 33.1% - rank of 36
2011 23.5% - rank of 381
2012 22.9% - rank of 284
2013 19.0% - rank of 333
2014 20.0% - Rank of 327

Not much difference between in our national rank of either 3 point attempts or 3 pointes made.


ChicosBailBonds


Hards Alumni

My favorite part of this thread is when a game of basketball is considered a way of deciding who is right and who is wrong.

What is next, "My dad can beat up your dad"?

GooooMarquette

Quote from: Hards_Alumni on March 21, 2014, 07:34:47 AM
My favorite part of this thread is when a game of basketball is considered a way of deciding who is right and who is wrong.

What is next, "My dad can beat up your dad"?

+1

Jay Bee

Quote from: The Equalizer on March 20, 2014, 11:46:39 PM
First, your answer to the question is wrong.   

We played the same number of games in 2009 as we did in 2012 but ranked 63rd with 664 3pt attempts
We played the same number of games in 2013 as we did in 2012 but ranked 309th with 497 3pt attempts

Therefore, saying we ranked 160th becuase "we played more games" is wrong. 

Next, there is nothing inherently "stupid" about using the number of 3 point shot attempts (and 3 point makes) to show the multi-year decline in 3 point shooting by Marquette.  You're basing that on the false premise that tempo and number of games played had any sort of significant impact.  They don't.  They are noise, not signal.

I already showed that the number of games in 2009 and 2013 wer ethe same. If we look at tempo, in 2009, we had 65.3 possesions per 40 minutes.  In 2013 we had 64.3--nearly identical tempo, exact same number of games.  Yet that one psession per game doesn't come close to explaining the 167 fewer 3 point attempts. 

Finally, we can look at 3 point field goal point percentage--that's a stat independent of tempo or number of games played--just a flat measure of what percenage of a team's points came from 3 pointers.

2009 28.0% - rank of 190th nationally.
2010 33.1% - rank of 36
2011 23.5% - rank of 381
2012 22.9% - rank of 284
2013 19.0% - rank of 333
2014 20.0% - Rank of 327

Not much difference between in our national rank of either 3 point attempts or 3 pointes made.


Good grief, you're slow. Read what I replied to - the 2012 "rank" of 157 that you described as "eye opening". Someone asked about it.

Let's go through some very simple things... pointing out we were ranked #157 based on total 3FGA all season isn't eye opening or particularly good information.

- MU played more games than many others teams. If you rank teams based on 3FGA's per game, #157 drops to #210.
- MU's estimated unadjusted tempo was nearly 71 possessions per game, 5 per game higher than the 66 D-I avg that year. (for add'l context, consider 5 * 35 games = add'l 175 possessions.)
- If you consider 3FGA/FGA, MU was ranked around 260th.
- Once you get even deeper and start considering 2FG%, 3FG% (which was actually slightly better, on an effective FG% basis, than 2FG%), free throw rate & percentage, etc... you get down to MU's 3-pointers contributing less than 23% of their total points. That's putting them up around 290th.

Comparing how often teams shoot 3-pointers by citing where they rank in 3FGA is flawed, illogical commentary. Teams play different number of games, they play different speeds, they play different styles.

#157 = eye opening? No. Even you can do better than this, bud. Do better.
The portal is NOT closed.

TAMU, Knower of Ball

Quote from: Goose on January 15, 2023, 08:43:46 PM
TAMU

I do know, Newsie is right on you knowing ball.


TAMU, Knower of Ball

Quote from: Ners on March 20, 2014, 10:25:13 PM
So PomEroy feels analyzing data from games a player plays less than 10 minutes can lead to nonsensical numbers while having a greater likelihood of breaking down??  Hmm..that's exactly my freaking point...the whole point all along is that you pumped Koenig as being so superior to Dawson - Koenig got a hell of a lot more consistent playing time, with 26 games over 10 minutes....while Dawson got a lot of scrap minutes and only 11 games all year out 32 where he played more than 10 minutes....therefore in 21 games the minutes he played "have a greater potential of breaking down and leading to non-sensical numbers."  I agree.  Can't judge a player's ability when the majority of time they get less than 10 minutes per game, particularly when it is often divided up into 3 different stints.  Could get skewed results...

I'm not a stats expert by any means. But I think the reason KP doesn't count stats for players who play less than 20 minutes is because there is potential to exaggerate or underexaggerate their numbers. A player who plays 1 minute but scores a bucket has a Points per 40 of 80. When really, he just happened to get a bucket in his one minute. Opposite is true too. A player who plays 1 minute and doesn't score has a Points per 40 of 0.

I don't think KP's omission proves your narrative of Dawson getting better with time. All it proves is that Dawson's numbers are skewed. Either high or low, we don't know.
Quote from: Goose on January 15, 2023, 08:43:46 PM
TAMU

I do know, Newsie is right on you knowing ball.


The Equalizer

Quote from: Jay Bee on March 21, 2014, 09:53:47 AM
Good grief, you're slow. Read what I replied to - the 2012 "rank" of 157 that you described as "eye opening". Someone asked about it.

Good grief, you can't read.  I said the six-year trend was eye opening.  Not one year's data point. 

Quote from: Jay Bee on March 21, 2014, 09:53:47 AM
Let's go through some very simple things... pointing out we were ranked #157 based on total 3FGA all season isn't eye opening or particularly good information.

No, its not.  Which is why I didn't say it was. 

The decline in 3 point attempts by Marquette year-over-year is NOT impacted by any difference in the number of games AT ALL.  And not significantly impacted by tempo.

Quote from: Jay Bee on March 21, 2014, 09:53:47 AM
- MU played more games than many others teams. If you rank teams based on 3FGA's per game, #157 drops to #210.
- MU's estimated unadjusted tempo was nearly 71 possessions per game, 5 per game higher than the 66 D-I avg that year. (for add'l context, consider 5 * 35 games = add'l 175 possessions.)
- If you consider 3FGA/FGA, MU was ranked around 260th.
- Once you get even deeper and start considering 2FG%, 3FG% (which was actually slightly better, on an effective FG% basis, than 2FG%), free throw rate & percentage, etc... you get down to MU's 3-pointers contributing less than 23% of their total points. That's putting them up around 290th.

This is all very nice, but it means nothing until you do it for the other five years.

Do the same for 2009, 2010, 2011, 2013 and 2014.  Then compare the same stat over six years and tell me if the trend I stated is any different.

Quote from: Jay Bee on March 21, 2014, 09:53:47 AM
Comparing how often teams shoot 3-pointers by citing where they rank in 3FGA is flawed, illogical commentary. Teams play different number of games, they play different speeds, they play different styles.

Again, this is noise.   The premise doesn't change. 

Quote from: Jay Bee on March 21, 2014, 09:53:47 AM
#157 = eye opening? No. Even you can do better than this, bud. Do better.

Well that was never the point. It was that we've had a multi-year decline in 3 point shooting.

At this point, you can either agree with me that, yes, we have had a multi year decline.  Or that somehow, these additional factors you keep mentioning change that premise. 

I'm continuing with my premise that the number of 3 point attempts (and makes) demonstrate a decline in 3 point shooting far in excess of anything that could be explained by tempo or number of games or any other FUD you want to bring up.


Previous topic - Next topic