collapse

Resources

2024-2025 SOTG Tally


2024-25 Season SoG Tally
Jones, K.10
Mitchell6
Joplin4
Ross2
Gold1

'23-24 '22-23
'21-22 * '20-21 * '19-20
'18-19 * '17-18 * '16-17
'15-16 * '14-15 * '13-14
'12-13 * '11-12 * '10-11

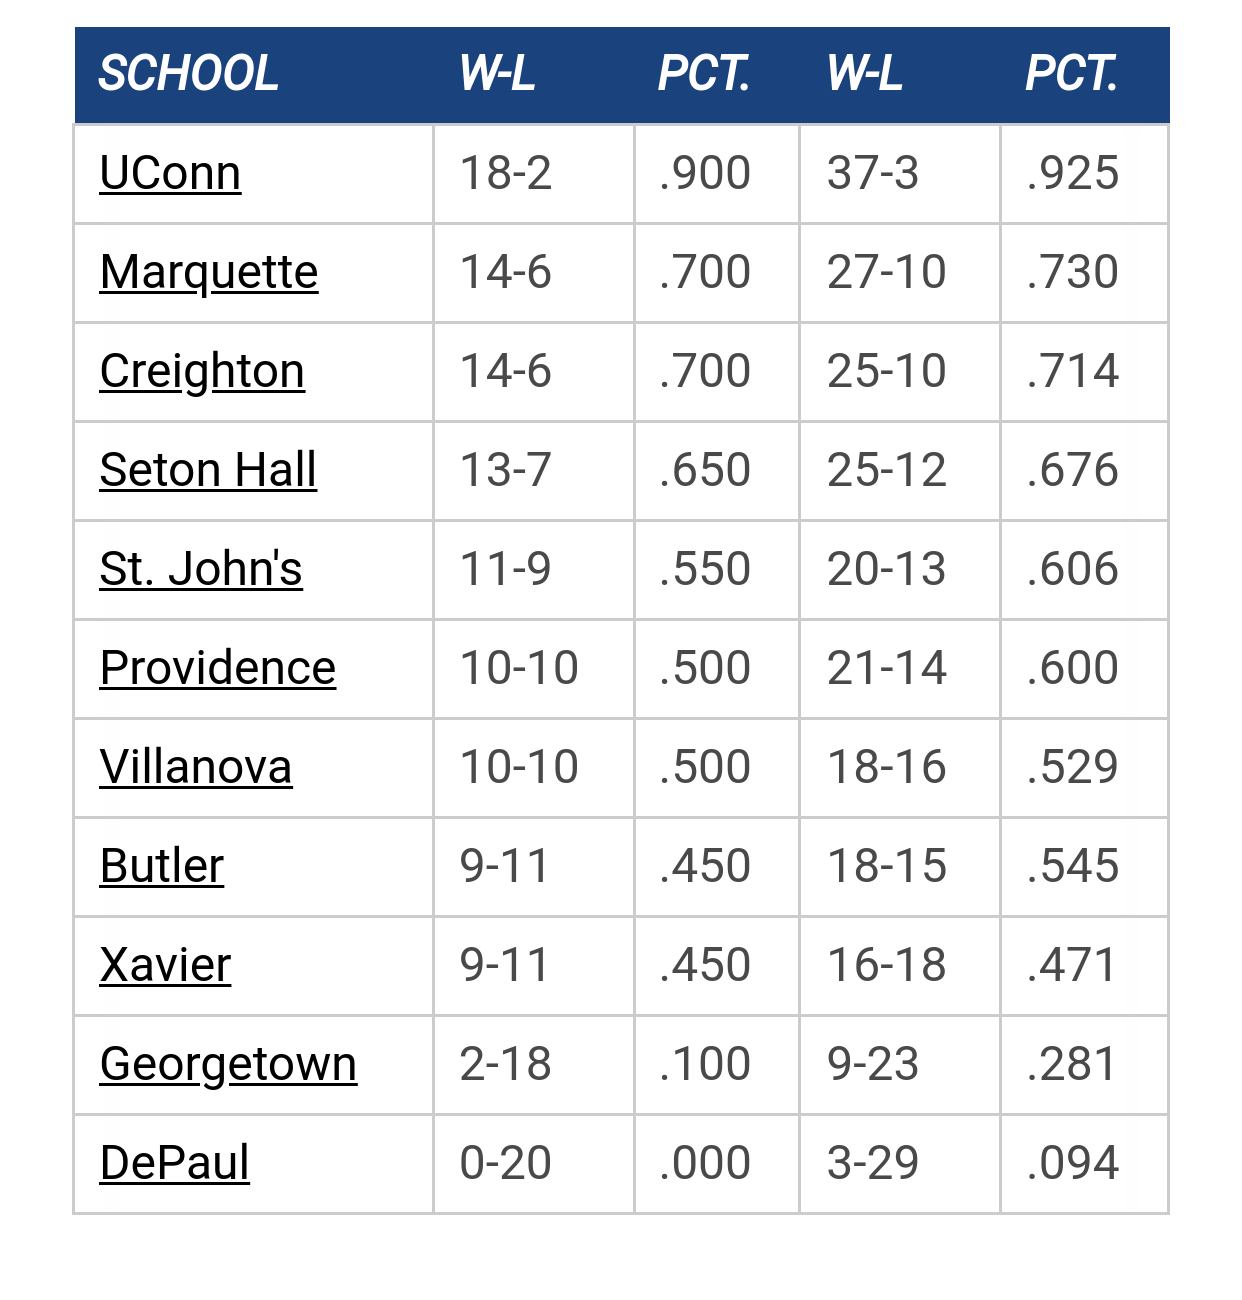
Big East Standings

Recent Posts

2025-26 Schedule by MU82
[September 11, 2025, 06:39:14 PM]

Please Register - It's FREE!

The absolute only thing required for this FREE registration is a valid e-mail address. We keep all your information confidential and will NEVER give or sell it to anyone else.
Login to get rid of this box (and ads) , or signup NOW!

Next up: A long offseason

Marquette
66
Marquette
Scrimmage
Date/Time: Oct 4, 2025
TV: NA
Schedule for 2024-25
New Mexico
75

mattyv1908

ORtg team average 105.6 (170th of 351)

Gardner 127.4, Thomas 110.8, Johnson 110.4, Otule 109.4, Mayo 109.2, J Wilson 105.0, Burton 103.4, D Wilson 96.9, Anderson 92.9, Dawson 88.1, Taylor 82.9, Flood 76.9

This number is skewed because of Davante Gardner being a statistical outlier compared to the rest of his team offensively.  Here's the breakdown if you take Gardner out of this stat.  Our team ORtg would drop to 98.1.

Thomas 110.8, Johnson 110.4, Otule 109.4, Mayo 109.2, J Wilson 105.0, Burton 103.4, D Wilson 96.9, Anderson 92.9, Dawson 88.1, Taylor 82.9, Flood 76.9

DRtg team average 100.2 (94th of 351)

Burton 93.5, Anderson 93.8, Taylor 99.4, J Wilson 101.1, Mayo 102.4, Otule 102.6, D Wilson 102.9, Gardner 103.6, Johnson 104.8, Flood 105.3, Dawson 105.4, Thomas 105.9

Here's a little perspective.  If you take our best five ORtg players regardless of position (Gardner, Thomas, Johnson, Otule, Mayo) and they played an entire 40 minutes together all season they'd average 77.8 pts/game and give up 71.2 pts/game a +6.1 differential.

If you take our five best DRtg players regardless of position (Burton, Anderson, Taylor, J Wilson, Mayo) and they played an entire 40 minutes together all season they'd average 67.7 points/game and give up 67.2 points/game a +0.5 differential.

Our best statistical offensive line up would put up over 10 points more a game and give up 4 points more a game than our best statistical defensive line up.

Food for thought.
Shut this board down at the opening tip.  If they win, open it back up.  If they lose, keep it shut it down until the next morning.  - Sultan of Slurpery

nathanziarek

With these advanced metrics, why even play the game?
Marquette Basketball on Reddit: http://reddit.com/r/mubb

mattyv1908

Quote from: Utile et Dulce on March 09, 2014, 02:34:59 PM
With these advanced metrics, why even play the game?

Some stats are predictive while others are reactive.

While Win Shares, PER (player efficiency rating) and all your typical stats are valuable, they are not predictive.  They are a measurement of what has occured.

ORtg and DRtg are predictive stats when a large enough sample size is taken into account.  The reason you still play the games is obvious and hopefully you just forgot to use the proper sarcasm color in your post.

There are adjusted ORtg and DRtg measurements and they need to be used when comparing players from different teams as those stats take into consideration the differences in quality of opponents' offensive and defensive abilities, but when simply comparing players on the same team they are unnecessary.
Shut this board down at the opening tip.  If they win, open it back up.  If they lose, keep it shut it down until the next morning.  - Sultan of Slurpery

UticaBusBarn

As always Matty, you have provided some very sound and insightful data.

A lot of folks will try and shoot holes in it as they argue their subjective bias, but your data supports what a lot of other folks having been saying on this board all year long - and, it has, indeed, been a long year

The data you have presented also underscores (pun intended) Coach Williams philosophy and the resulting outcome this past year:)

Anyway, thank you.

forgetful

Quote from: UticaBusBarn on March 09, 2014, 03:12:42 PM
As always Matty, you have provided some very sound and insightful data.

A lot of folks will try and shoot holes in it as they argue their subjective bias, but your data supports what a lot of other folks having been saying on this board all year long - and, it has, indeed, been a long year

The data you have presented also underscores (pun intended) Coach Williams philosophy and the resulting outcome this past year:)

Anyway, thank you.

This may be what you are saying, but the stats say our best players by positions are:

PG  Derrick Wilson
SG  Jake Thomas
SF  J. Wilson (Mayo/Johnson if you go a 3 G lineup)
PF  Gardner
C   Otule

or a lineup of

D. Wilson
J. Thomas
Mayo
J. Wilson
Gardner/Otule

Which is exactly the two lineups Buzz has used the vast majority of minutes this season.  For the record the DRtg is not remotely predictive as it focuses too heavily on individual stats and D is a team effort.  For instance, if you asked anyone at MU who their 3 best defenders are they wouldn't be Burton/Anderson/Taylor.  In fact if you asked Taylor if he was one of the best 3 defenders he would probably laugh at you.

mattyv1908

Quote from: forgetful on March 09, 2014, 03:30:09 PM
This may be what you are saying, but the stats say our best players by positions are:

PG  Derrick Wilson
SG  Jake Thomas
SF  J. Wilson (Mayo/Johnson if you go a 3 G lineup)
PF  Gardner
C   Otule

or a lineup of

D. Wilson
J. Thomas
Mayo
J. Wilson
Gardner/Otule

Which is exactly the two lineups Buzz has used the vast majority of minutes this season.  For the record the DRtg is not remotely predictive as it focuses too heavily on individual stats and D is a team effort.  For instance, if you asked anyone at MU who their 3 best defenders are they wouldn't be Burton/Anderson/Taylor.  In fact if you asked Taylor if he was one of the best 3 defenders he would probably laugh at you.

Forgetful, you couldn't be more wrong about DRtg.

I doesn't take anything into consideration except points scored over 100 possessions.  Blocks, steals, defensive rebounds, charges taken or any other individual defensive stat is not used in the calculation.

Deonte Burton when on the court allowed 93.3 opponent points per 100 defensive possessions (with any other combination of players playing with him).  That is the only determining factor.  Opposing team's points when he's on the floor divided by a static measurement (possessions).
Shut this board down at the opening tip.  If they win, open it back up.  If they lose, keep it shut it down until the next morning.  - Sultan of Slurpery

mattyv1908

Our overall best line up by position based on mashing up the offense/defense ratings would look like this.

PG - Wilson
SG - Mayo
SF - Burton
PF - Wilson
C - Gardner

Thomas and Otule would see significant minutes as well

I think the discussion of Wilson as our starting PG over Dawson should only be allowed if we're asking how Buzz could so incorrectly guage his ability level and thought he could be counted on to win games for the team this year from that position.  He is statistically better than Dawson at this point.
Shut this board down at the opening tip.  If they win, open it back up.  If they lose, keep it shut it down until the next morning.  - Sultan of Slurpery

Jay Bee

Quote from: mattyv1908 on March 09, 2014, 02:17:17 PM
ORtg team average 105.6 (170th of 351)

Gardner 127.4, Thomas 110.8, Johnson 110.4, Otule 109.4, Mayo 109.2, J Wilson 105.0, Burton 103.4, D Wilson 96.9, Anderson 92.9, Dawson 88.1, Taylor 82.9, Flood 76.9

This number is skewed because of Davante Gardner being a statistical outlier compared to the rest of his team offensively.  Here's the breakdown if you take Gardner out of this stat.  Our team ORtg would drop to 98.1.

Thomas 110.8, Johnson 110.4, Otule 109.4, Mayo 109.2, J Wilson 105.0, Burton 103.4, D Wilson 96.9, Anderson 92.9, Dawson 88.1, Taylor 82.9, Flood 76.9

DRtg team average 100.2 (94th of 351)

Burton 93.5, Anderson 93.8, Taylor 99.4, J Wilson 101.1, Mayo 102.4, Otule 102.6, D Wilson 102.9, Gardner 103.6, Johnson 104.8, Flood 105.3, Dawson 105.4, Thomas 105.9

Here's a little perspective.  If you take our best five ORtg players regardless of position (Gardner, Thomas, Johnson, Otule, Mayo) and they played an entire 40 minutes together all season they'd average 77.8 pts/game and give up 71.2 pts/game a +6.1 differential.

If you take our five best DRtg players regardless of position (Burton, Anderson, Taylor, J Wilson, Mayo) and they played an entire 40 minutes together all season they'd average 67.7 points/game and give up 67.2 points/game a +0.5 differential.

Our best statistical offensive line up would put up over 10 points more a game and give up 4 points more a game than our best statistical defensive line up.

Food for thought.

There are major problems with your analysis. Statistically unsound; too limited.
The portal is NOT closed.

mattyv1908

Quote from: Jay Bee on March 09, 2014, 04:29:56 PM
There are major problems with your analysis. Statistically unsound; too limited.

It's not my analysis.  It's right there for anyone to look at.  It's 100% accurate based on every player on our team's playing time and points scored and allowed.

Please expound on why these stats are limited are what a more complete set of stats would consist of.

You can note that if you included other popular metrics such as PER (player efficiency ratings) and Win Shares the list would be eerily similar.  I'll include those if you want so you would then have three measures calculated differently that tell the same story.

Is it limited simply because it is counter intuitive to your subjective opinions?
Shut this board down at the opening tip.  If they win, open it back up.  If they lose, keep it shut it down until the next morning.  - Sultan of Slurpery

NersEllenson

Great stuff Matty...question...where did you get the stats from?  Pomroy throws out all games where a player doesn't even play 10 minutes regardless of what happens in calculating their ORating, as he deems 10 minutes of action statistically irrelevant...

Particularly telling..that in all of his years of analysis he too knows you can't draw conclusions from a player getting less than 10 minutes of action per game.  Dawson failed to play more than 10 minutes in 20 of our 31 games...thereby his sample size per Pomroy is essentially 11 games...
"I'm not sure Cadougan would fix the problems on this team. I'm not even convinced he would be better for this team than DeWil is."

BrewCity77, December 8, 2013

mattyv1908

Sports-Reference.com

They include every minute a player plays in their calculations.  Right or wrong can be debatable but I think when multiple evaluation tools come up with a similar consensus it shows an overall trend.  Pomroy is a great reference as well.
Shut this board down at the opening tip.  If they win, open it back up.  If they lose, keep it shut it down until the next morning.  - Sultan of Slurpery

forgetful

Quote from: mattyv1908 on March 09, 2014, 03:35:42 PM
Forgetful, you couldn't be more wrong about DRtg.

I doesn't take anything into consideration except points scored over 100 possessions.  Blocks, steals, defensive rebounds, charges taken or any other individual defensive stat is not used in the calculation.

Deonte Burton when on the court allowed 93.3 opponent points per 100 defensive possessions (with any other combination of players playing with him).  That is the only determining factor.  Opposing team's points when he's on the floor divided by a static measurement (possessions).

Sorry, I'm getting the different statistical measures mixed up.  Regardless, no coach that has played us would say that Burton/Taylor are 2 of our 3 best defenders. 

I really like Burton and think that he is getting it now, but he has overall been a poor defender this season. 

The metric is flawed in college the sample size is not sufficiently large to negate inherent errors.  For instance.  Lets look at a four possession sample.

Player A gets a steal and block in two possessions, but just watches a player make two layups on the next two.  He would average 4 points per 4 possession, but be really bad at defense.

Player B plays his man tough, denies him getting the ball for 30 seconds. Late in the shot clock the player gets the ball each of the 4 possessions and shoots up prayers.  2 of 4 go in.  Same Drtg, much better defender.

In the NBA there are so many possessions that such statistical anomalies will average out. 

Second aspect.  In the NBA opponents are at least of similar quality, so 10 possessions against team A is roughly equivalent to 10 possessions against team B.  In college, some players see most of their action against far lesser quality opponents, that allows them to increase their rtg.  Again leading to statistical anomalies. 

mattyv1908

Quote from: Jay Bee on March 09, 2014, 04:29:56 PM
There are major problems with your analysis. Statistically unsound; too limited.

I have to take another run at this rediculous post.

You do realize that this same set of statistics resulted in showing Jae Crowder, Davante Gardner, Darius Johnson-Odom, Jimmy Butler, and Lazar Hayward to be some of the best players on previous Marquette teams.

In fact the only player that didn't have great ORtg and DRtg numbers was Vander Blue, and his numbers were not poor.  Again, no stat is completely perfect in either reflecting on or predicting 100% of a player's worth.  There are always outliers.  Joseph Fulce had the second highest ORtg on 2010-2011 team.  Was he the 2nd best offensive player?  Absolutely not, but it does show that the offense produced a lot of points as a unit when he was on the floor so he absolutely contributed to his team's offensive success.

Here's a list of the top 5 players each of the last five years based on player efficiency.  Let's see if you can spot a correlation and also a difference with this year's list.

09-10:  Hayward, Butler, Otule, Fulce, DJO
10-11:  Crowder, Butler, Gardner, Fulce, DJO
11-12:  Crowder, Gardner, DJO, Otule, J Wilson
12-13:  Gardner, Taylor, J Wilson, Otule, Blue
13-14:  Gardner, Burton, Mayo, J Wilson, Otule

Now here's your top five guys in minutes played the last five years

09-10:  Butler, Hayward, Cubillan, DJO, Acker
10-11:  Butler, DJO, Crowder, Buycks, Cadougan
11-12:  Crowder, DJO, Cadougan, Blue, J Wilson
12-13:  Blue, Cadougan, Lockett, J Wilson, Gardner
13-14:  D Wilson, Thomas, J Wilson, Gardner, Mayo

Is it a coincidence that record is 17-14 and our two leading players in terms of minutes played are our 8th and 9th ranked efficiency players?  Positions do dictate line ups to some extend, but you cannot find that on any previous team I just listed.
Shut this board down at the opening tip.  If they win, open it back up.  If they lose, keep it shut it down until the next morning.  - Sultan of Slurpery

mattyv1908

#13
Quote from: forgetful on March 09, 2014, 05:41:28 PM
Sorry, I'm getting the different statistical measures mixed up.  Regardless, no coach that has played us would say that Burton/Taylor are 2 of our 3 best defenders.  

I really like Burton and think that he is getting it now, but he has overall been a poor defender this season.  

The metric is flawed in college the sample size is not sufficiently large to negate inherent errors.  For instance.  Lets look at a four possession sample.

Player A gets a steal and block in two possessions, but just watches a player make two layups on the next two.  He would average 4 points per 4 possession, but be really bad at defense.


Player B plays his man tough, denies him getting the ball for 30 seconds. Late in the shot clock the player gets the ball each of the 4 possessions and shoots up prayers.  2 of 4 go in.  Same Drtg, much better defender.

In the NBA there are so many possessions that such statistical anomalies will average out.  

Second aspect.  In the NBA opponents are at least of similar quality, so 10 possessions against team A is roughly equivalent to 10 possessions against team B.  In college, some players see most of their action against far lesser quality opponents, that allows them to increase their rtg.  Again leading to statistical anomalies.  

There's been approximately 2127 offensive and defensive possessions this season each.  I think that's plenty of sample size.
Shut this board down at the opening tip.  If they win, open it back up.  If they lose, keep it shut it down until the next morning.  - Sultan of Slurpery

tower912

The challenge is finding the right balance of players and position.    For example, the stats that show Derrick is better than Dawson means that Buzz really has no choice but to play the 8th/9th best guy a lot of minutes.   STjr's leg injury has impacted his minutes.    I also have no problem bringing quality off of the bench.    IMO, it should have been Derrick, Jake, Deonte, Jamil, and CO with Todd and Ox off of the bench but getting starter minutes.    Simply because I like bringing offense off of the bench rather than defense.    But it is hard to argue against Derrick, Todd, Deonte, Jamil, and Davante being effective.   
Luke 6:45   ...A good man produces goodness from the good in his heart; an evil man produces evil out of his store of evil.   Each man speaks from his heart's abundance...

It is better to be fearless and cheerful than cheerless and fearful.

forgetful

Quote from: mattyv1908 on March 09, 2014, 06:11:02 PM
I have to take another run at this rediculous post.

You do realize that this same set of statistics resulted in showing Jae Crowder, Davante Gardner, Darius Johnson-Odom, Jimmy Butler, and Lazar Hayward to be some of the best players on previous Marquette teams.

In fact the only player that didn't have great ORtg and DRtg numbers was Vander Blue, and his numbers were not poor.  Again, no stat is completely perfect in either reflecting on or predicting 100% of a player's worth.  There are always outliers.  Joseph Fulce had the second highest ORtg on 2010-2011 team.  Was he the 2nd best offensive player?  Absolutely not, but it does show that the offense produced a lot of points as a unit when he was on the floor so he absolutely contributed to his team's offensive success.

Here's a list of the top 5 players each of the last five years based on player efficiency.  Let's see if you can spot a correlation and also a difference with this year's list.

09-10:  Hayward, Butler, Otule, Fulce, DJO
10-11:  Crowder, Butler, Gardner, Fulce, DJO
11-12:  Crowder, Gardner, DJO, Otule, J Wilson
12-13:  Gardner, Taylor, J Wilson, Otule, Blue
13-14:  Gardner, Burton, Mayo, J Wilson, Otule

Now here's your top five guys in minutes played the last five years

09-10:  Butler, Hayward, Cubillan, DJO, Acker
10-11:  Butler, DJO, Crowder, Buycks, Cadougan
11-12:  Crowder, DJO, Cadougan, Blue, J Wilson
12-13:  Blue, Cadougan, Lockett, J Wilson, Gardner
13-14:  D Wilson, Thomas, J Wilson, Gardner, Mayo

Is it a coincidence that record is 17-14 and our two leading players in terms of minutes played are our 8th and 9th ranked efficiency players?  Positions do dictate line ups to some extend, but you cannot find that on any previous team I just listed.

You do realize that in every year you list at least 2 players with the most minutes played are not amongst the 5 most efficient (same for this year).  So all years including this year are the same in that regards.  As Tower points out this year is an anomaly in that our best PG is a little worse compared to previous years.

mattyv1908

Quote from: forgetful on March 09, 2014, 06:35:36 PM
You do realize that in every year you list at least 2 players with the most minutes played are not amongst the 5 most efficient (same for this year).  So all years including this year are the same in that regards.  As Tower points out this year is an anomaly in that our best PG is a little worse compared to previous years.

I'm well aware of that, but our leading minute guy always was within the top five as well.

I'm a realist.  The loss of Duane Wilson to injury and Vander Blue's departure left Buzz playing two guys he probably didn't intend to play nearly as much.  That's why I believe it's even more critical to handle the other positions appropriately.

In another topic I showed how not starting Davante Gardner for the three minutes of each half costs the team 2 points per game.  I'm fine with the late game defense/offense substitutions.  It's smart on many levels, but it's examples like this that have cost this team.

When you are forced as a coach to use Wilson/Dawson at PG for an entire 40 minutes it means you have to utilize your talent and the other four positions to it's max or you have a 17-14 regular season.  For better or worse, we didn't capitalize on that this year.  This year required Buzz to have great game management and unfortunately he was probably only average in that regard.
Shut this board down at the opening tip.  If they win, open it back up.  If they lose, keep it shut it down until the next morning.  - Sultan of Slurpery

Jay Bee

matty - you're not understanding the numbers well and taking leaps to draw conclusions that are wacky.

Bad claims that are not supported by facts.
The portal is NOT closed.

mattyv1908

#18
Quote from: Jay Bee on March 09, 2014, 06:50:43 PM
matty - you're not understanding the numbers well and taking leaps to draw conclusions that are wacky.

Bad claims that are not supported by facts.

Please elaborate.  That's a pretty vague answer that so far has no statistical data you've presented to support it.

You now have posted twice on a topic titled 'Final regular season advanced stats' in which it's obvious you don't agree with the results yet you've provided not one bit of contradictory evidence, not one iota of analysis supporting your position and we're supposed to take your subjective viewpoint as a factual statement simply because you stated it.

I'm sorry for you that your confirmation bias is so strong you can be right in your own mind simply because you think it to be so.  Tyrants and despots would love you.
Shut this board down at the opening tip.  If they win, open it back up.  If they lose, keep it shut it down until the next morning.  - Sultan of Slurpery

jesmu84

Quote from: mattyv1908 on March 09, 2014, 07:02:25 PM
Please elaborate.  That's a pretty vague answer that so far has no statistical data you've presented to support it.

You now have posted twice on a topic titled 'Final regular season advanced stats' in which it's obvious you don't agree with the results yet you've provided not one bit of contradictory evidence, not one iota of analysis supporting your position and we're supposed to take your subjective viewpoint as a factual statement simply because you stated it.

I'm sorry for you that your confirmation bias is so strong you can be right in your own mind simply because you think it to be so.  Tyrants and despots would love you.

*grabs popcorn*

mattyv1908

Quote from: forgetful on March 09, 2014, 05:41:28 PM
Sorry, I'm getting the different statistical measures mixed up.  Regardless, no coach that has played us would say that Burton/Taylor are 2 of our 3 best defenders. 

I really like Burton and think that he is getting it now, but he has overall been a poor defender this season. 

The metric is flawed in college the sample size is not sufficiently large to negate inherent errors.  For instance.  Lets look at a four possession sample.

Player A gets a steal and block in two possessions, but just watches a player make two layups on the next two.  He would average 4 points per 4 possession, but be really bad at defense.

Player B plays his man tough, denies him getting the ball for 30 seconds. Late in the shot clock the player gets the ball each of the 4 possessions and shoots up prayers.  2 of 4 go in.  Same Drtg, much better defender.

In the NBA there are so many possessions that such statistical anomalies will average out. 

Second aspect.  In the NBA opponents are at least of similar quality, so 10 possessions against team A is roughly equivalent to 10 possessions against team B.  In college, some players see most of their action against far lesser quality opponents, that allows them to increase their rtg.  Again leading to statistical anomalies. 


I wouldn't necessarily disagree with you at all.  I will say this about Burton, not only does he lead DRtg for this year's team but he also is our leader when you combine steal% and block%.  Rougly 10% of his defensive possessions result in him either stealing or blocking an opponents shot.

Here's where this is critical.  Say an opponent is shooting 50%.  If Burton plays 20 defensive possessions his season average indicates that 2 of those 20 possessions will result in a shot not getting a chance to convert to a made FG.  Shooting 50% would result in 9 made FGs.  Now take a 'better' overall defender that doesn't ever steal the ball or block a shot.  That same team shooting 50% would have 10 made FGs which results in 2-3 more points over those 20 defensive possessions.

His disruptiveness on defense is a big factor as to why his DRtg is better than anyone on the team.  It's also a reason why Jake Thomas has the worst DRtg on the team despite him being considered a solid defender as he has very small steal and block ratios.
Shut this board down at the opening tip.  If they win, open it back up.  If they lose, keep it shut it down until the next morning.  - Sultan of Slurpery

77ncaachamps

But does it factor in who is on the court when Anderson, Taylor, and Burton are defenders?

They're usually up against the second string aka more offensively inept.
SS Marquette

forgetful

Quote from: mattyv1908 on March 09, 2014, 08:07:31 PM

I wouldn't necessarily disagree with you at all.  I will say this about Burton, not only does he lead DRtg for this year's team but he also is our leader when you combine steal% and block%.  Rougly 10% of his defensive possessions result in him either stealing or blocking an opponents shot.

Here's where this is critical.  Say an opponent is shooting 50%.  If Burton plays 20 defensive possessions his season average indicates that 2 of those 20 possessions will result in a shot not getting a chance to convert to a made FG.  Shooting 50% would result in 9 made FGs.  Now take a 'better' overall defender that doesn't ever steal the ball or block a shot.  That same team shooting 50% would have 10 made FGs which results in 2-3 more points over those 20 defensive possessions.

His disruptiveness on defense is a big factor as to why his DRtg is better than anyone on the team.  It's also a reason why Jake Thomas has the worst DRtg on the team despite him being considered a solid defender as he has very small steal and block ratios.

You do realize that if a defender is a better defender the opposing player will not shoot 50% but less than his average.  If he is a poorer defender they will shoot better than there average.  Your analysis above assumes that no matter who is the defender they shoot the same % minus the effect of steals/blocks.

forgetful

Quote from: mattyv1908 on March 09, 2014, 06:46:48 PM
I'm well aware of that, but our leading minute guy always was within the top five as well.

I'm a realist.  The loss of Duane Wilson to injury and Vander Blue's departure left Buzz playing two guys he probably didn't intend to play nearly as much.  That's why I believe it's even more critical to handle the other positions appropriately.

In another topic I showed how not starting Davante Gardner for the three minutes of each half costs the team 2 points per game.  I'm fine with the late game defense/offense substitutions.  It's smart on many levels, but it's examples like this that have cost this team.

When you are forced as a coach to use Wilson/Dawson at PG for an entire 40 minutes it means you have to utilize your talent and the other four positions to it's max or you have a 17-14 regular season.  For better or worse, we didn't capitalize on that this year.  This year required Buzz to have great game management and unfortunately he was probably only average in that regard.

Didn't see that thread, but that is just ridiculous.  It assumes that he would play those minutes in addition to his normal average (which is dictated by conditioning not coaching).  This is not true. 

You are vastly over-relying on statistics in this case.  There are three kinds of lies...lies, damn lies and statistics.

mattyv1908

Quote from: forgetful on March 09, 2014, 08:55:53 PM
You do realize that if a defender is a better defender the opposing player will not shoot 50% but less than his average.  If he is a poorer defender they will shoot better than there average.  Your analysis above assumes that no matter who is the defender they shoot the same % minus the effect of steals/blocks.

It's a team shooting FG% you do realize that?
Shut this board down at the opening tip.  If they win, open it back up.  If they lose, keep it shut it down until the next morning.  - Sultan of Slurpery

Previous topic - Next topic