collapse

Resources

2024-2025 SOTG Tally


2024-25 Season SoG Tally
Jones, K.10
Mitchell6
Joplin4
Ross2
Gold1

'23-24 '22-23
'21-22 * '20-21 * '19-20
'18-19 * '17-18 * '16-17
'15-16 * '14-15 * '13-14
'12-13 * '11-12 * '10-11

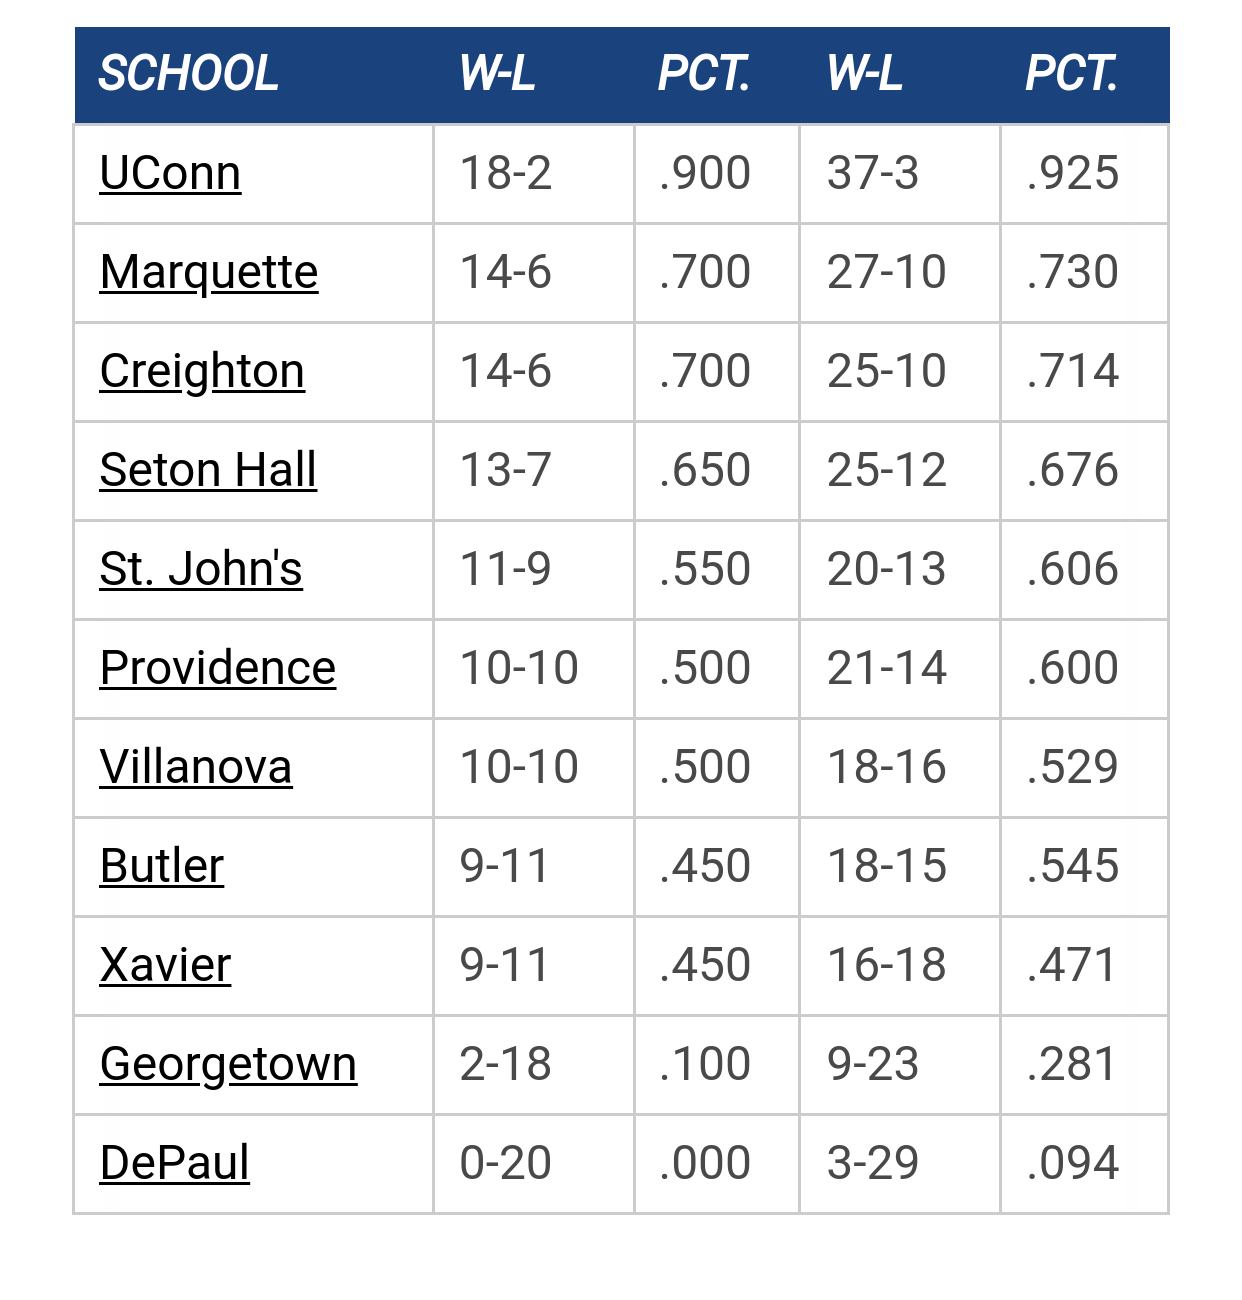
Big East Standings

Recent Posts

NM by MU82
[Today at 06:37:24 PM]


Recruiting as of 9/15/25 by MU82
[Today at 05:54:04 PM]


[Cracked Sidewalks] Previewing Marquette's Schedule by tower912
[September 20, 2025, 01:22:16 PM]

Please Register - It's FREE!

The absolute only thing required for this FREE registration is a valid e-mail address. We keep all your information confidential and will NEVER give or sell it to anyone else.
Login to get rid of this box (and ads) , or signup NOW!

Next up: A long offseason

Marquette
66
Marquette
Scrimmage
Date/Time: Oct 4, 2025
TV: NA
Schedule for 2024-25
New Mexico
75

bamamarquettefan

Rutgers went 4 of 11 from the line – 8 of 11 would be average so they could have scored four more points with an average night.  Coming into the game, MU had only "given up" 61% accuracy on the line, the 11th lowest total of any team.

I've been assuming all year this has just been luck and that someone is going to burn us at the line.  However, I do wonder if there is any correlation between our opponents' terrible foul shooting and the fact that we could be wearing them out with intense play, and/or the fact that we allow them to the line so rarely that when they get there they aren't comfortable.  MU is the 5th best team in the country at keeping opponents from getting to the line – only Ohio State, Creighton, Notre Dame and Florida are better.  Haven't studied this, just getting curious.

As bad as everyone except Jimmy looked down the stretch from the line, we still were 20 of 32 for the night which is only two less than an average team would hit in 32 attempts (22 of 32), so once again we got to the line a lot better than our opponent and hit a higher percentage than the opponent.
The www.valueaddsports.com analysis of basketball, football and baseball players are intended to neither be too hot or too cold - hundreds immerse themselves in studies of stats not of interest to broader fan bases (too hot), while others still insist on pure observation (too cold).


MarquetteDano

I posted an article on this board about 3-4 years ago talking about teams free throw "percentage defense".  The study found that although there certainly is a correlation between the schedule you play and those teams free throw shooting percentage, there is also part of it that couldn't be explained.  And it was outside of the normal two or three standard deviations of luck.

The study found three teams who had played similar teams but had enough disparity in the free throw percentage that it could not be explained to normal deviation.  One team I specifically remember was Syracuse, which teams also seem to shoot poorly against regardless of their opponents' ability to normally shoot free throws.

I can't find the article now.  I wonder if there are various factors such as:  closer games having an impact (i.e. choking), home crowds louder than others, rims at certain stadiums, teams who run a lot tiring other team, etc..

StillAWarrior

Quote from: Dr. Blackheart on January 06, 2011, 12:46:25 AM
Our team FT Rate against Rutgers of 74.4 was our 11th highest rated game in 15 years.

http://statsheet.com/mcb/games/stats?&season1=1996&season2=2010&team=marquette&stat=ft_rate_pct

Something's not quite right.  We were 20 of 32.  That equals 62.5%.  If you click on the game in that list, even that lists us at 62.5%.  Am I misunderstanding the data?  If you click on the games in the list, none of the game data matches the list data.  Another example, in the top game that it lists us at 100%, the specific game data shows us at 35 of 50 (70%).  I'm sure I'm missing something, and would appreciate it if someone could explain.
Never wrestle with a pig.  You both get dirty, and the pig likes it.

NYWarrior

Quote from: StillAWarrior on January 06, 2011, 10:16:30 AM
Something's not quite right.  We were 20 of 32.  That equals 62.5%.  If you click on the game in that list, even that lists us at 62.5%.  Am I misunderstanding the data?  If you click on the games in the list, none of the game data matches the list data.  Another example, in the top game that it lists us at 100%, the specific game data shows us at 35 of 50 (70%).  I'm sure I'm missing something, and would appreciate it if someone could explain.

Free-throw rate (FTR) & Free-throw % are different figures.   FTR is the ratio of Free Throw Attempts to Field Goal Attempts.  Free-throw percentage is how many FTs you make vs how many FTs you attempt.

StillAWarrior

Quote from: NYWarrior on January 06, 2011, 10:24:10 AM
Free-throw rate (FTR) & Free-throw % are different figures.   FTR is the ratio of Free Throw Attempts to Field Goal Attempts.  Free-throw percentage is how many FTs you make vs what you attempt.

Thank you.
Never wrestle with a pig.  You both get dirty, and the pig likes it.

Previous topic - Next topic