collapse

Resources

2024-2025 SOTG Tally


2024-25 Season SoG Tally
Jones, K.10
Mitchell6
Joplin4
Ross2
Gold1

'23-24 '22-23
'21-22 * '20-21 * '19-20
'18-19 * '17-18 * '16-17
'15-16 * '14-15 * '13-14
'12-13 * '11-12 * '10-11

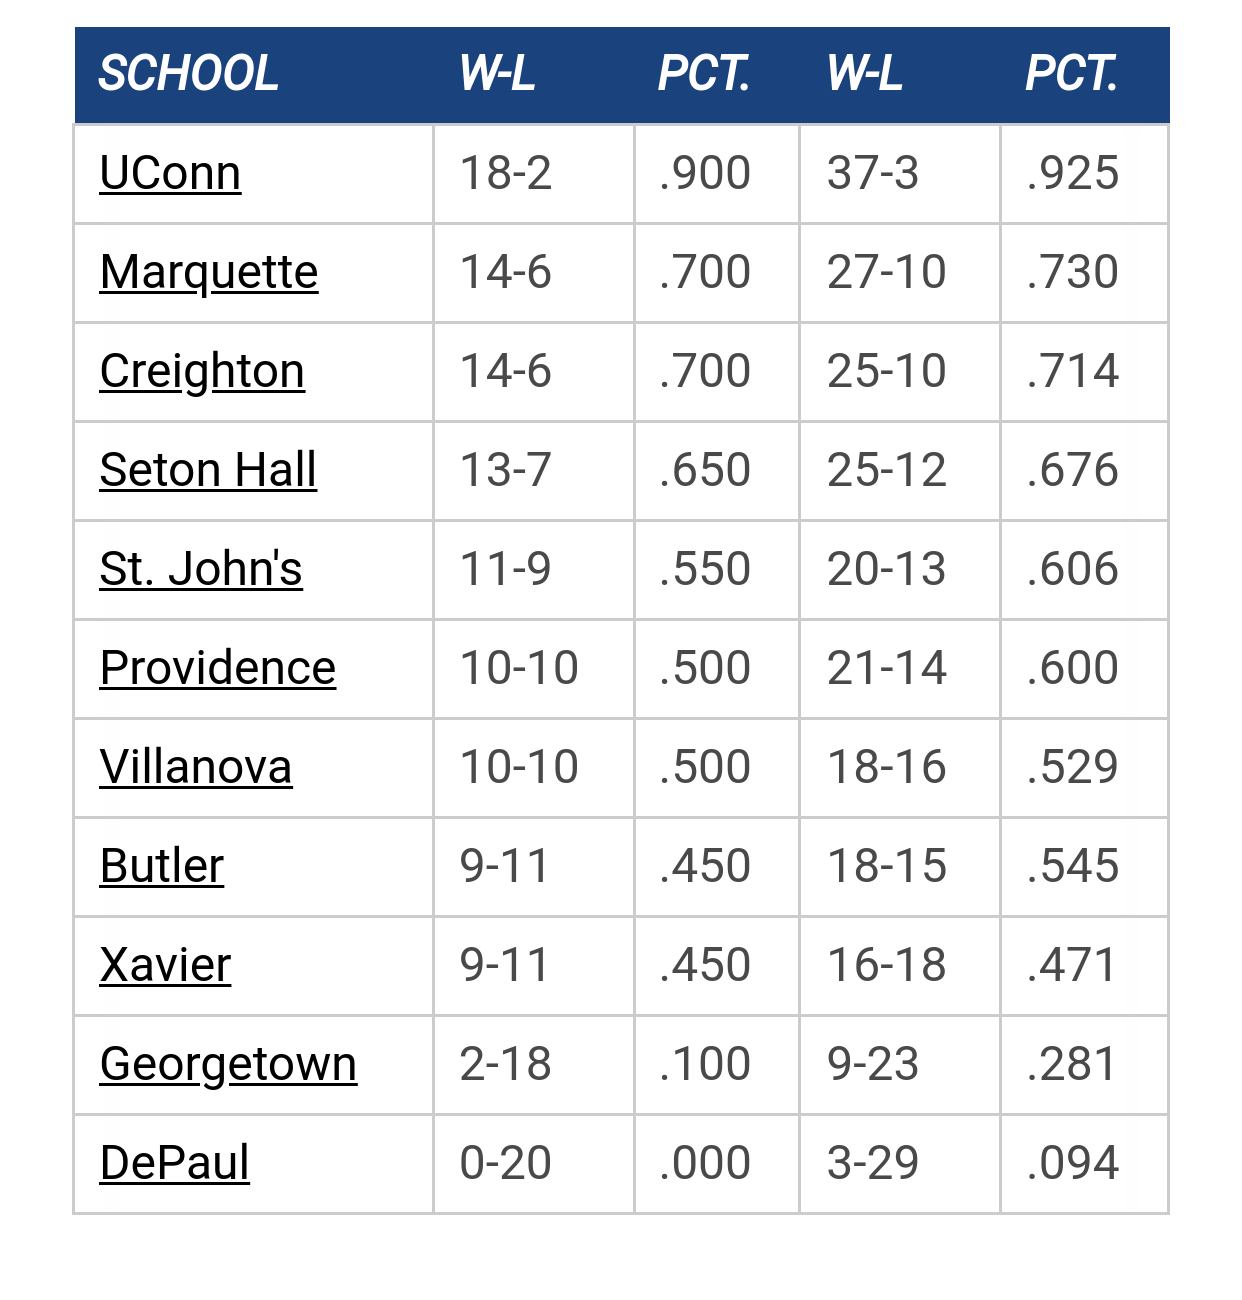
Big East Standings

Recent Posts

Pope Leo XIV by DoggyDaddy
[Today at 02:14:47 PM]


Kam update by #UnleashSean
[May 09, 2025, 10:29:30 PM]


Proposed rule changes( coaching challenges) by MU82
[May 09, 2025, 08:33:38 PM]


Ethan Johnston to Marquette by muwarrior69
[May 09, 2025, 05:02:23 PM]


Recruiting as of 4/15/25 by MuMark
[May 09, 2025, 03:09:00 PM]


OT MU adds swimming program by The Sultan
[May 09, 2025, 12:10:04 PM]


2025-26 Schedule by Galway Eagle
[May 08, 2025, 01:47:03 PM]

Please Register - It's FREE!

The absolute only thing required for this FREE registration is a valid e-mail address. We keep all your information confidential and will NEVER give or sell it to anyone else.
Login to get rid of this box (and ads) , or signup NOW!

Next up: A long offseason

Marquette
66
Marquette
Scrimmage
Date/Time: Oct 4, 2025
TV: NA
Schedule for 2024-25
New Mexico
75

jmayer1

Granted this is only Marquette's second year in the Big East, but I always hear a lot of complaining about how the Big East isn't as good as everyone thinks and the Big Ten is so awesome (especially on the JSOnline forum) so I thought this story were pretty interesting:

http://insider.espn.go.com/ncb/insider/news/story?id=2740989   


WashDCWarrior

Thanks, can you post the article for us non-Insider subscribers?

jmayer1

Here it is, some of the tables can be difficult to read.


Last year's NCAA Tournament disrupted the balance of conference power in ways that had pundits proclaiming the advent of a new order in college hoops. The most celebrated surprise was the emergence of little-known mid-majors such as George Mason and Bradley. But within the ranks of the power conferences -- the ACC, Big East, Big Ten, Big 12, Pac-10 and SEC -- the results were almost as unexpected. The Big East and Big Ten, conference powerhouses of the regular season, made abrupt exits from The Dance. Meanwhile, the SEC and Pac-10, traditional tourney underachievers, stuck around to the bitter end.

There's no doubt that last year's tourney results bucked conference trends. The real questions are:
1. Did it have any impact on overall conference performance in the 64-team era?
2. Is there any evidence that the 2006 tourney is a harbinger of things to come in 2007?
3. Did the SEC and Pac-10 significantly change their standing among the other power conferences?
4. Was last year just the beginning of a mid-major movement toward parity with the power conferences? Let's find out.

SEC on the rise -- but ACC still the undisputed leader
At first blush, it wouldn't appear as though the 2006 tourney had a big impact on the rankings of the power conferences during the 64-team era. In terms of won-loss record, the ACC still holds a commanding 20-game lead over the Big East, which managed to gain just a half-game on its archrival.

Top power conferences by record and achievement

Conference '06 Win  '06 Loss '06 W% Total wins Total losses Total win % GB Change '05-06 Final Fours Champs

ACC        6   4  0.600   221  105   0.678   --    --        21  6
Big East  11  8   0.579   188  112   0.627  20.0  +0.5   10   4
SEC       13  5   0.722   162  106   0.604   25.0  +3.0   12   4
Big Ten   3   6   0.333   181  120   0.601   27.5  -2.5   15   3
Big 12     4   4   0.500   143  104   0.579   38.5  -1.0   11   1
Pac-10    8   4  0.667    109  84    0.565   45.5  +1.0   7     2

Behind the two front-runners, however, a dramatic shift has taken place. With its 13-5 record, the SEC overtook the Big Ten, which suffered a 3-6 flameout in last year's tourney. Not only did the SEC achieve a 5½-game swing over the Big Ten, but it gained 2½ games on the Big East -- and could catch them for second place with another strong showing in 2007. In fact, it could be argued that the SEC has already caught the Big East. If you evaluate the conferences in terms of Final Four combatants and tourney champs, the SEC has tied the Big East with four champions in the modern era -- and is now ahead 12-10 in Final Four teams.

The Pac-10 had the second-best showing in the 2006 tourney among power conferences. Its 8-4 record helped the league gain two games on the Big 12. But it remains the weakest of the Big Six, a hefty seven games away from climbing out of the cellar. One consolation: the Pac-10 can boast more tourney champs (UCLA in '95 and Arizona in '97) than the Big 12 (Kansas in '88).

Who's the top power conference overachiever?
It would take several years for the ACC to relinquish its huge 20-plus game bulge on the rest of the power conferences. But won-loss records aren't the be-all and end-all of evaluating tourney performance. Considering that ACC tourney entrants have an average seed of 4.29 -- almost one seed better than entrants from the nearest competing power conference (the Big Ten's average seed is 5.12) -- you would expect them to post a better winning percentage. Heck, with its 5.71 average seed, the SEC's record might qualify as a more impressive feat than the ACC's. After all, it's lower than that of the Big East (5.57) and even the Pac-10 (5.62) and Big 12 (5.65).

So how do you factor seeding into the evaluation of tourney performance? You do it with the PASE statistic, that's how. PASE, or performance against seed expectations, compares the number of games a conference won at each seed position to the number of games the average team at that seed has won. By tallying up the differences -- some of which will be positive and others negative -- we can determine the total number of games each conference has performed above or below its seed expectations. Here's how the numbers break down after the 2006 NCAA Tournament:

Power conference deviation from seed expectations, 1985-2006
Seed ACC  Big East SEC Big Ten Big 12 Pac-10
   1   9.95  -0.18 3.14  1.59  -8.14 -7.50
   2   6.45  -2.95 -1.91 -3.27 4.50  0.91 
   3   3.89  4.59  1.38  -5.98 -2.63 0.30 
   4   2.66  3.19  0.13  -3.94 -2.41 -2.27
   5   0.78  0.08  2.08  6.78  0.26  -4.33
   6  -0.27  4.59  -2.56  -0.83 -2.26 1.73 
   7  -1.52  1.03  1.18  -0.23 -0.41 -1.26
   8   3.53  4.07  0.60  0.37  -1.55 -1.63
   9  -1.90  1.36  -0.48 -0.22 0.94  0.10 
  10   3.02  4.07  0.07  -0.64  -2.93 -1.95
  11  -0.50  2.00  3.50 0.50  -2.50  0.50 
  12   0.50  -1.50 3.00     2.50  -2.00
  13           1.50     
  +/- Wins  26.60  20.35  10.13  -5.85  -13.11  -17.41

Total teams  111  116  110 123 105  86 

Win diff./teams (PASE)  0.240  0.175  0.092  -0.048 -0.125  -0.202 

PASE change '05 to '06  -0.017  -0.026  0.047 -0.043 -0.010  0.050


The 111 ACC teams that have played in the tourney since 1985 have won 26.6 more games than their seed position would dictate. That works out to a 0.240 PASE, which can be described in one of two ways: either every ACC team wins about a quarter game more than seed projections, or one in every four ACC team wins one game more than seeding says it should.

Calculating power conference performance on the basis of PASE doesn't change who comes out on top of the rankings. The ACC is still the pre-eminent conference ... but its lead over the Big East is more tenuous. Both conferences actually underachieved against seed expectations last year -- but the Big East saw its PASE decline by more; this despite a respectable 11-8 record. The problem was that only two of the Big East teams (No. 6 West Virginia and No. 7 Georgetown) actually notched more wins than typical teams with their seeds. Yes, top-seeded UConn and Villanova got to the Elite Eight ... but that actually constitutes underperformance for your run-of-the-mill No. 1 seed.

Despite its decline, however, the Big East is still within single-tourney striking distance of the ACC. You only need to look at the fortunes of the Big Ten and Pac-10 to realize how much PASE ground can be made up in one tournament. The Big Ten's woeful performance knocked 0.043 off its PASE, while the Pac-10 improved its PASE by 0.050. Added together, that works out to a 0.093 swing, larger than the lead the ACC holds over the Big East. Of course, the volatility of PASE works both ways. Yes, the Big East could catch the ACC, but it could also be overtaken by the surging SEC, which added .047 to its PASE last year and made up 0.073 on the Big East.

The SEC achieved an even bigger differential against the Big Ten, of which it had been only 0.050 ahead going into last year's tourney. With a 0.090 swing in 2006 PASE fortunes, however, the SEC isn't in jeopardy of losing third place to the Big Ten -- at least not this year.

Big Ten remains PASE leader of the last decade
Before all of you Big Ten fans start hanging your heads, you can take heart in the fact that your conference is still the top PASE leader of the last 10 years. Here are the PASE results since 1997: TOP POWER CONFERENCES, 1997-2006 (Performance Against Seed Expectations)
RK Conference  Team # Wins Losses Win % Avg. seed +/- Wins PASE

1 Big Ten  55 87  54 0.617 5.40 +9.60 +0.175 
2 Big East  54 83 51 0.619  5.59 +8.60 +0.159 
3 Pac-10 44 71  43 0.623 5.18  +2.60 +0.059
4 ACC  46  90 43 0.677 4.04  +2.50 +0.054
5 Big 12 52 72  52 0.581  5.92  -1.27 -0.025 
6 SEC  57 74  55 0.574  5.19  -10.55 -0.185


The Big Ten's plus-0.175 PASE was built from several surprising tourney runs, including Ohio State's Final Four run as a No. 4 seed in 1999, Indiana's run to the 2002 finals as a No. 5 seed, Wisconsin's surprise 2000 Final Four appearance as a No. 8 seed and Michigan State's semifinal run two years ago as a No. 5 seed. These overachievements were enough to outweigh the debacle of 2006 and other assorted underperformances by almost 10 wins. The Big East isn't far behind. Just a single overachieving win away, the Big East could easily catch the Big Ten with a solid 2007 tourney.

That would really give Big East fans something to crow about, particularly since their nemesis, the ACC, has been just 2½ games above expectations for the last decade. The ACC's fall from grace isn't nearly as precipitous, however, as the SEC's. Just a few minutes ago, you were reading about how great an overachiever the SEC was in 2006. Unfortunately, last year has been more the exception than the rule. The SEC has lost nearly 11 games more than seeding projections, easily the worst of the six power conferences.

Special kudos go to the Pac-10. While the conference is a massive 17-win underachiever for the entire 64-team era, it's actually a 2.6-win overachiever since 1997. That puts it in third place among the power conferences, a touch ahead of the ACC.

Are mid-majors really gaining power?
To hear the tourney experts tell it, last year was a breakthrough season for mid-majors -- the year that little-known and underappreciated programs all over the country finally ended the dominance of the big, bad power conferences. No doubt, as fans sit down to fill out their tourney brackets this March, they'll be paying special attention to mid-major darkhorses in the hopes of finding the next George Mason. So how warranted is all this hoopla over mid-major conferences? Are they really on the verge of consistent tourney success?

Before we answer these questions, we need to address a more burning issue: What the heck is a mid-major anyway? Well, if you go by the official mid-major poll, practically every conference that gets into the tourney besides the six power conferences is a mid-major -- except the Atlantic 10 and Conference USA, which I suppose are either "low-power" or "hi-major" conferences.

But let's be real: Conferences like the Big South and Big Sky, which field teams with average seeds of 15.4 and 14.3, respectively, and have never had two bids in single year, aren't on par with conferences like the WAC and Missouri Valley.

So here's my handy-dandy method for defining a mid-major: If a conference has had multiple bids in at least two tourneys over the course of the 64-team era, or multiple bids in at least one year over the last decade, then it is a mid-major. Otherwise, it's a small conference. This will likely annoy fans of conferences like the Ivy League, Northeast and Southland, who are used to seeing their teams in the mid-major poll. But look at the flip side: At least you don't have to see your conference trolling at the bottom of the mid-major PASE rankings. (Before I get to that list, Mountain West fans might want to call for a new definition of mid-majors.)

Using the multiple-bid criteria, the last decade has had 10 mid-major conferences: the Atlantic 10, Big West, Colonial, Conference USA, Horizon, Mid-American, Missouri Valley, Mountain West, West Coast and Western Athletic. The Sun Belt has satisfied the criteria as a mid-major over the 22-year history of the modern era (though they've been a one-bid conference since 1994) -- as have defunct conferences like the Great Midwest, Metro, SWAC and the ever-amorphous Independents.

If you look at the performance of mid-majors against the power conferences over the entire course of the 64-team era, you'll see that they're clearly second fiddle in every category. They win less often (.430 winning percentage to .614), they have fewer championships (2 to 20), and -- despite the lower expectations that an average 9.3 seed brings -- they have a lower PASE. Take a look at the numbers:

TOP CONFERENCE TYPES, 1985-2006 (Performance Against Seed Expectations)
RK Conference size Team # Wins Losses Win % Avg. seed +/- Wins PASE
1 Power  651 1004  631  0.614 5.31 20.70 0.032
2 Mid-major 460 345 458 0.430  9.31 -10.82 -0.024 
3 Small 297 37  297 0.111 14.24 -9.89 -0.033
While the 651 power conference teams have won about 21 games more than their seeding says they should've, the 460 mid-major teams have won about 11 fewer games. Meanwhile, the small conferences have done a solid job of being tourney doormats, averaging worse than a 14 seed, winning about 10 percent of their games and failing the most to live up to seed expectations.

Those are the overall numbers for the 64-team era. What about the last decade? Well ... considering all the noise about the growing strength of the mid-majors, you'd think that the last 10 years would show a marked improvement in their performance. In fact, the mid-major conferences have actually regressed. Not only are fewer mid-major schools getting into the tourney (19.8 teams per tourney since 1997 compared to 20.9 overall), but they're also lower-seeded -- and they struggle more to live up to those seeding expectations. To add insult to injury, the mid-major conferences have a lower PASE value (minus-.040) over the last decade than small conferences (minus-.027). Take a gander:

TOP CONFERENCE TYPES, 1997-2006 (Performance Against Seed Expectations)
RK Conference size Team # Wins Losses Win % Avg. seed +/- Wins PASE
1 Power  308 477  298 0.615 5.25 11.48  0.037
2 Mid-major 198 137 198 0.409  9.61 -7.90 -0.040
3 Small 134 16  134 0.107 14.33 -3.58 -0.027
These aren't exactly the glowing numbers that mid-major proponents might expect. And they would've been much worse had George Mason and Bradley not combined to contribute 5.25 games of overachievement to the cause. So before you buy into all the chatter about mid-majors achieving parity with the power conferences (and make some wacky bracket picks), listen to the numbers: They say that last year was more of an aberration than the harbinger of a trend.

Know your top-performing mid-majors
While it's true that upset-laden tourney years are usually followed by a return to normalcy, there's always a chance that March Madness could produce two straight seasons of insanity. And if you're the type who likes to apply a contrarian strategy to your bracket picks, it's good to know which conferences have been the recent overachievers among the mid-majors.

Not surprisingly, the winningest mid-major conferences are not necessarily the top tourney performers. The WAC (23-23) and Conference USA (34-36) have the best records over the last 10 years, but neither is among the top three PASE overachievers. In fact, Conference USA ranks ninth out of the 10 mid-majors in PASE, its 36 tourney teams losing nearly seven more games than seeding would warrant for a minus-.190 PASE. Only the Mountain West was worse, with a PASE that translates to about one in four teams underachieving by one game. Here's how the rest of the mid-majors stack up in the PASE rankings:

TOP MID-MAJOR CONFERENCES, 1997-2006 (Performance Against Seed Expectations)
RK Conference Team # Wins Losses Win % Avg. seed +/- Wins PASE
1 Colonial  11 6  11 0.353 12.73 2.88  0.261
2 Mid-American 12 8 12 0.400  11.58 2.33  0.194
3 Horizon 13 8  13 0.381 11.92 1.88  0.144 

4 Western Athletic 23 23 23 0.500  8.09 1.58  0.068
5 West Coast 14  13  14 0.481 9.07 0.05 0.004
6 Missouri Valley 22 13 22 0.371  10.45 -0.30 -0.014
7 Big West 11 3  11 0.214 12.73 -0.70 -0.064
8 Atlantic 10 30 24 30 0.444 8.20 -2.53 -0.084
9 Conference USA 36 34  36 0.486 6.47 -6.85 -0.190
10 Mountain West 16 5 16 0.238  11.06 -3.60 -0.225

Be careful not to leap to any big conclusions about Colonial teams. Sure, they have the best PASE of any mid-major by a solid margin. But all their overachievement was accomplished by George Mason last year. Without the Patriots' 3.55-game overachievement from the No. 11 seed, the Colonial would be a PASE underachiever. The MAC is a different story; it's had five teams contribute to their overperformance: Western Michigan in 1998, Miami (Ohio) in 1999, Kent State in 2001 and 2002 and Central Michigan in 2003. They haven't sprung an upset in the last three tourneys, but the record suggests that the MAC might be due.

If recent history is any indication, the Horizon League and the WAC are also hotbeds for springing upsets. The Horizon's Wisconsin-Milwaukee was a No. 11 seed winner last year and a two-game winner as a No. 12 seed in 2005. Butler was also a No. 12 seed Cinderella in 2003. For the WAC, Tulsa (consecutive upsets as No. 12 and 13 seeds in 2002 and 2003) and Nevada (two wins as a No. 10 seed in 2004 and one as a No. 9 in 2005) have been the main Cinderellas.

The Missouri Valley is getting all the media attention this year as the main mid-major challenger to the power conferences. Based on last year's performance, that attention is justified. Sweet 16 runs by both No. 7 seed Wichita State and No. 13 seed Bradley amounted to nearly a three-game overachievement. But for the last 10 years, the MVC is actually an underachiever -- and, Creighton, the conference's premier program, is the biggest culprit. It remains to be seen whether the MVC will build on last year's overachievement or revert to its decade-long pattern of underperformance.

What to look for in the 2007 tourney
With powerhouses like Florida, LSU, Alabama and Kentucky, the SEC seems poised for strong representation in the tourney's later rounds. But great expectations are a double-edged sword in the madness of March. The SEC could pass the Big East to become the second-best conference tourney performer ... or, with a couple of early exits, it could continue its decade-long slump of underperformance.

The Pac-10's ability to handle success will also get tested. It's not unreasonable to think that a strong tourney run would make it the second-highest power conference overachiever since 1997. But the odds are higher that the ACC will overtake them in the 10-year PASE rankings.

Long burdened with high tourney expectations, the ACC may finally have the opportunity to go to The Dance as relative underdogs. That's always a solid position from which to build up PASE value. The Big Ten is in the same boat. Everyone thought it would be the monster conference in last year's tourney, but instead, the Big Ten was home watching the tourney after two rounds. This year, the league likely will garner the same mix of middle seeds from which it's overachieved in the past 10 years.

The power conference that's in the most desperate need of a good tourney showing might be the Big 12. Kansas -- and Bill Self -- can't afford another early exit, and other teams like Texas and Texas A&M will need to play over their heads.

On the mid-major front, the big question is whether the conferences can repeat their breakout year of 2006 and prove all the "parity with the powers" proponents right. No doubt at least one of the mid-major conferences will emerge as a giant killer. It will be interesting to see whether that conference is the front-running Missouri Valley, one of the traditional overachievers like the MAC and Horizon or a left-field historical doormat like the Big West or Mountain West. Heck, given how the small conferences have risen up in recent years, we could even be looking at an Ivy League or Sun Belt Cinderella.


WashDCWarrior

Thanks for posting.  I assume they treat teams based on their conference at the time.  i.e. Marquette was C-USA in 2003 and BE last year.


Previous topic - Next topic