collapse

Resources

25-26 SOTG Tally

2025-26 Season SoG Tally
Ross6
James Jr4
Parham1
Stevens1

'24-25 * '23-24 * '22-23
'21-22 * '20-21 * '19-20
'18-19 * '17-18 * '16-17
'15-16 * '14-15 * '13-14
'12-13 * '11-12 * '10-11

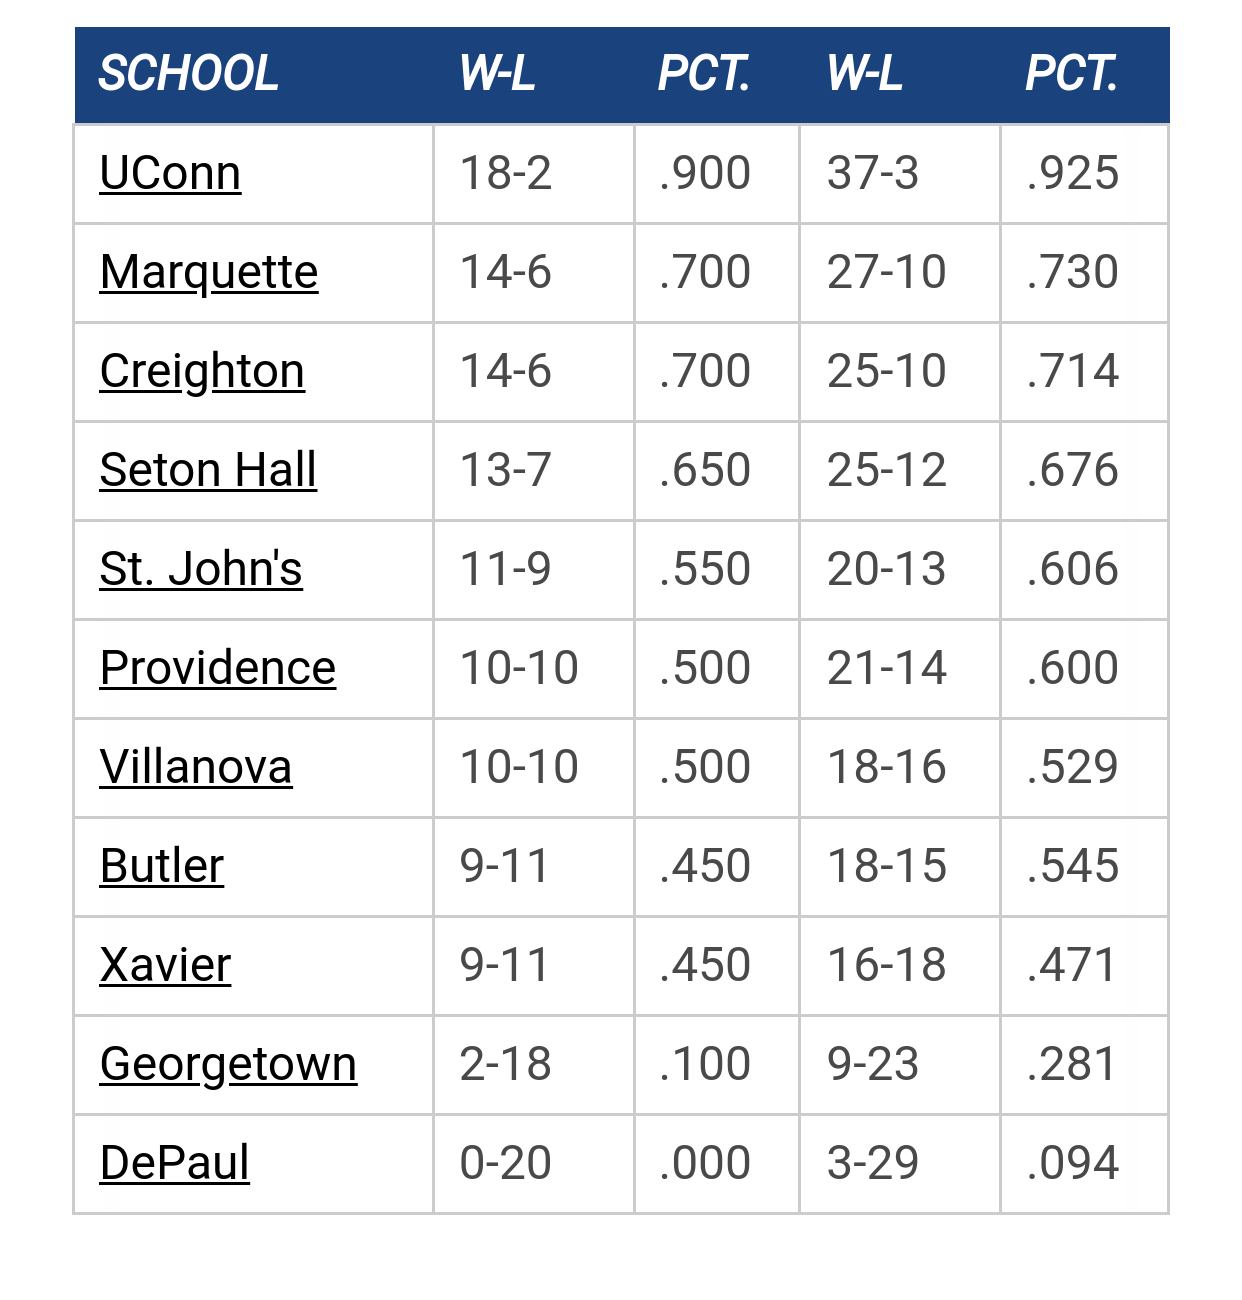
Big East Standings

Recent Posts

Best College Player You've Seen vs MU? by AverageJoe
[Today at 01:14:23 AM]


Recruiting as of 6/15/26 by tower912
[July 22, 2026, 09:07:03 PM]


What future non-cons would you like to see? by mug644
[July 22, 2026, 06:00:04 PM]


Open practice by mileskishnish72
[July 22, 2026, 04:56:03 PM]


Summer workouts by PointWarrior
[July 20, 2026, 02:51:39 PM]

Please Register - It's FREE!

The absolute only thing required for this FREE registration is a valid e-mail address. We keep all your information confidential and will NEVER give or sell it to anyone else.
Login to get rid of this box (and ads) , or signup NOW!

Next up:  NA

Marquette
87
Marquette
Scrimmage
Date/Time: Oct 2026
TV: NA
Schedule for 2025-26
Xavier
89

PaintTouches

Since 2015, only 4 teams have finished the previous season in the top-20 of Torvik's rankings and returned 80%+ of minutes played. Marquette will be in some very rare company this season. But does that mean simply a high floor, or is there room to raise the ceiling?

https://painttouches.com/2023/09/19/what-does-returning-mega-minutes-tell-us/


Pepe Sylvia

I enjoyed the conclusion part, seems things are looking good.
twitterx: @HBOCEOofTits

Shooter McGavin

TRGV

2012 Warrior

While I am excited that the MU continuity shows greater correlation, would it be better to look at how Shaka has done in the past?  This is likely also rough direction given the offense at MU being a variant of Shaka's past stops.

DoctorV


PaintTouches

Quote from: 2012 Warrior on September 19, 2023, 11:47:05 AM
While I am excited that the MU continuity shows greater correlation, would it be better to look at how Shaka has done in the past?  This is likely also rough direction given the offense at MU being a variant of Shaka's past stops.

I did think about that. Texas 2021 was one of the other P6 teams that returned 80+, and jumped from 68th the year before to 19th that season. But I think there was enough data in the article to show that in general, there is a significant tie in between continuity and performance. Another chart wouldn't have made much of a difference.   

cheebs09


Previous topic - Next topic