collapse

Resources

2024-2025 SOTG Tally


2024-25 Season SoG Tally
Jones, K.10
Mitchell6
Joplin4
Ross2
Gold1

'23-24 '22-23
'21-22 * '20-21 * '19-20
'18-19 * '17-18 * '16-17
'15-16 * '14-15 * '13-14
'12-13 * '11-12 * '10-11

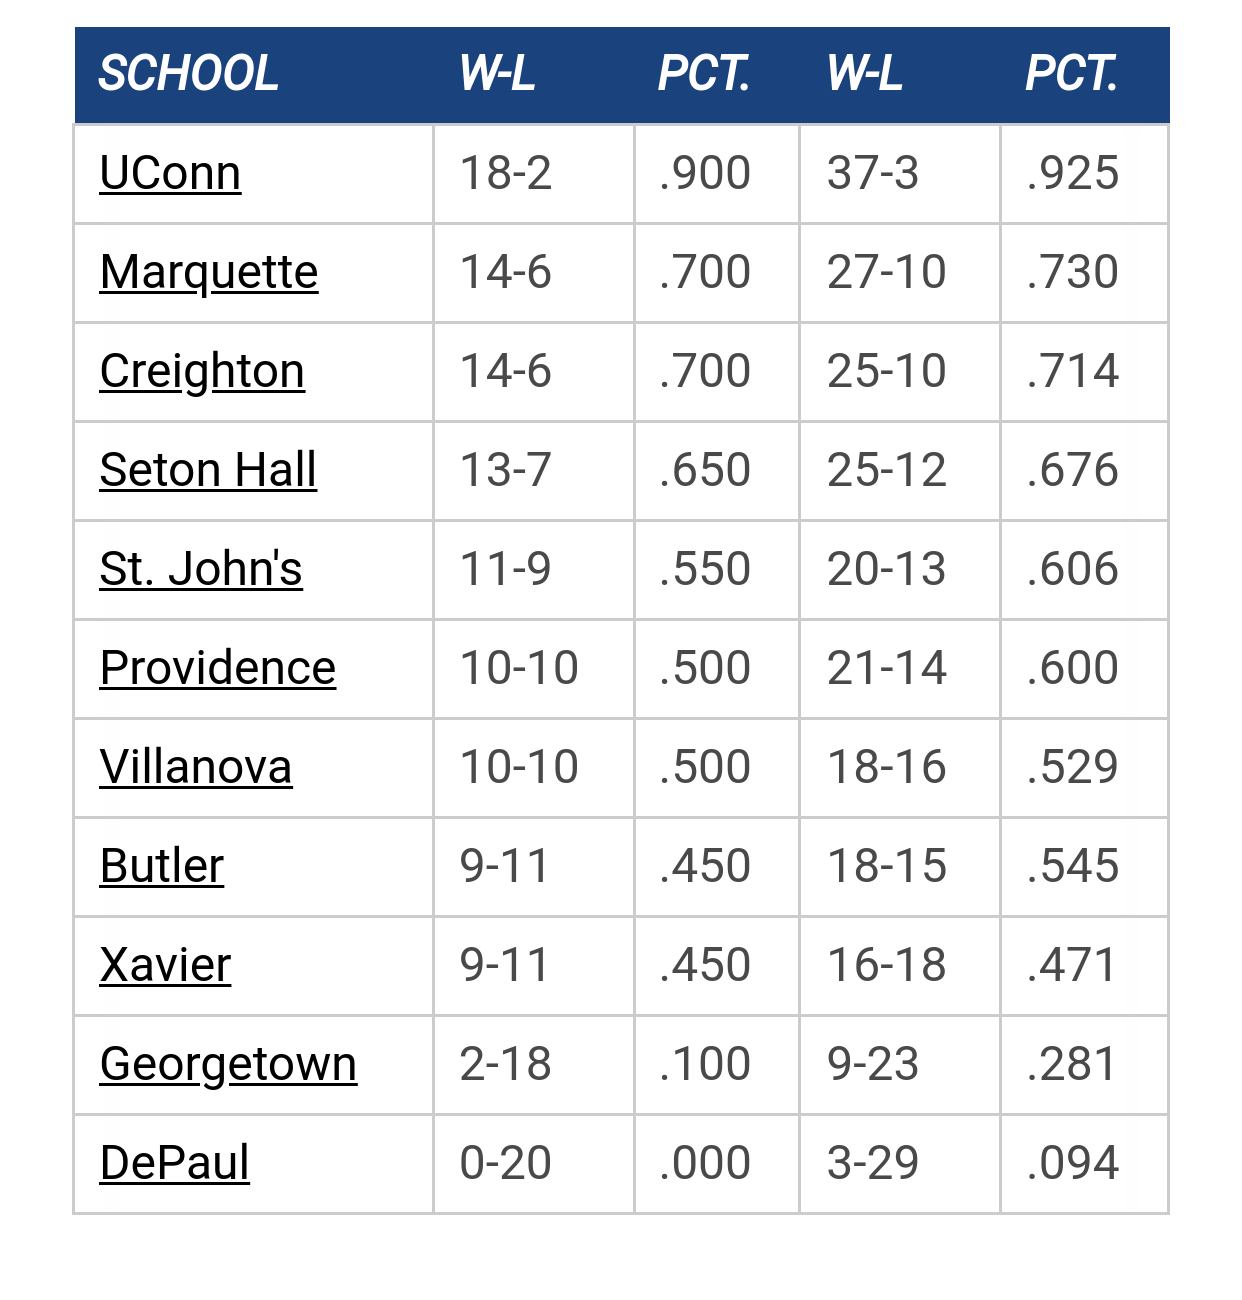
Big East Standings

Recent Posts

To the Rafters by The Sultan
[Today at 02:02:43 PM]


Marquette NBA Thread by Jay Bee
[Today at 11:51:18 AM]


Recruiting as of 5/15/25 by tower912
[Today at 11:15:09 AM]


2025-26 Schedule by Billy Hoyle
[Today at 10:19:22 AM]


NCAA settlement approved - schools now can (and will) directly pay athletes by Uncle Rico
[Today at 05:58:53 AM]


Stars of Tomorrow Show featured Adrian Stevens by tower912
[July 06, 2025, 08:50:48 PM]


25 YEARS OF THE AP TOP 25 by Galway Eagle
[July 06, 2025, 01:43:39 PM]

Please Register - It's FREE!

The absolute only thing required for this FREE registration is a valid e-mail address. We keep all your information confidential and will NEVER give or sell it to anyone else.
Login to get rid of this box (and ads) , or signup NOW!

Next up: A long offseason

Marquette
66
Marquette
Scrimmage
Date/Time: Oct 4, 2025
TV: NA
Schedule for 2024-25
New Mexico
75

Henry Sugar


At a macro level, the numbers were generally consistent across both halves, but the components were different.

MU shot the ball remarkably well in both halves. The first half was stronger in general because the TO% and OR% were better than the 2H. In the second half, hot shooting masked some of the issues with rebounding. The TO% was really good in both halves.

Defensively, it's similar (0.99 ppp vs 1.01 ppp). However, TN shot 57% eFG% in the first half, which was masked with 33% TO%. In the 2H, TN only shot 39% eFG% (which is very good), but did a much better job protecting the ball and attacking the glass.

Other nuggets

Carlino's game against GT was a net points of 14.8. That's the highest I've seen since starting tracking the advanced stats.

Duane Wilson's game against TN was a top 2% performance. Against NJIT he had a top 15% performance. Of course, against Georgia Tech Duane had a bottom 2% performance. eh... redshirt freshman

Carlino's TO% is 11.4%. Derrick's is 14%. Carlino was good last year (15%), but the best Derrick has been is 20%.

I don't know what to make of Juan. He's shooting the ball really efficiently (60%) but still turning it over too much (23%). He's also nationally ranked at OR% and steal%. All of this at usage rate that is significantly higher than any previous year.
A warrior is an empowered and compassionate protector of others.

mileskishnish72


Silkk the Shaka

Awesome as always.

When you say something like Duane's performance against UT was top 2%, do you mean relative to college basketball as a whole this year? Relative to historical seasons? Relative to MU all-time? Relative to your own stats database? Other?

Also, Juan has definitely stepped up into the "do all the little things" senior role we needed this year, as evidenced by his OR% and Steal%. I hope the best is yet to come for him, he deserves it after sticking it out through some long stretches of DNPs & low PT.

dgies9156

The best part of this analysis is that we're shooting efficiently.

After last year's offensively challenged team, this is a nice trend that should only get better if we have an inside game when Luke Fischer gets here.

Big read into this is that Coach Wojo is beginning to make a significant difference.

Henry Sugar

#4
Quote from: Ellenson Family Reunion on December 03, 2014, 09:33:20 AM
When you say something like Duane's performance against UT was top 2%, do you mean relative to college basketball as a whole this year? Relative to historical seasons? Relative to MU all-time? Relative to your own stats database? Other?

/wonkish

This is only for my stats database. I've collected the net points per player per game for about 3-4 years. Last year I created a rough frequency distribution of all the data points to see how good (or bad) various performances were. Currently, there are 831 data points. I have more data, but don't add it all the time because I'm only looking for an approximation of how good a performance was.

Net points attempts to assign credit for the margin of victory (or loss). For example, we beat Tennessee by 8 points. Who gets credit for that margin of victory? There are a bunch of flaws with net points. However, like defensive rating, I've gone back and forth but ultimately have decided to use the metric. I feel it passes the reasonable test, shows new perspective on performance through a season, and I understand the flaws enough to not take the metric overly serious. I also don't share the nitty gritty details of the metric because of its flaws, and because it can be harsh to particular players in particular games. It does no good to provide per-game grades and to say that Derrick Wilson cost the team 4.5 points against MSU.

We beat Tennessee by 8 points. Some players were net negative on the game margin. Over 2/3 of all my data points run from -2 to 2 net points. Above 5 net points is the top 14% and where I start to take notice. Duane Wilson got credit for 10 net points against Tennessee. 10 net points is in the top 2% of my distribution. Out of 831 data points, only ten of them are 10 points or higher. Only two times last year did anyone (Gardner 2x) get to 10 net points.

Again, it's a rough distribution using a flawed metric. However, according to that, Duane Wilson had a top 2% performance against Tennessee.
A warrior is an empowered and compassionate protector of others.

Silkk the Shaka


Previous topic - Next topic