collapse

'23-'24 SOTG Tally


2023-24 Season SoG Tally
Kolek11
Ighodaro6
Jones, K.6
Mitchell2
Jones, S.1
Joplin1

'22-23
'21-22 * '20-21 * '19-20
'18-19 * '17-18 * '16-17
'15-16 * '14-15 * '13-14
'12-13 * '11-12 * '10-11

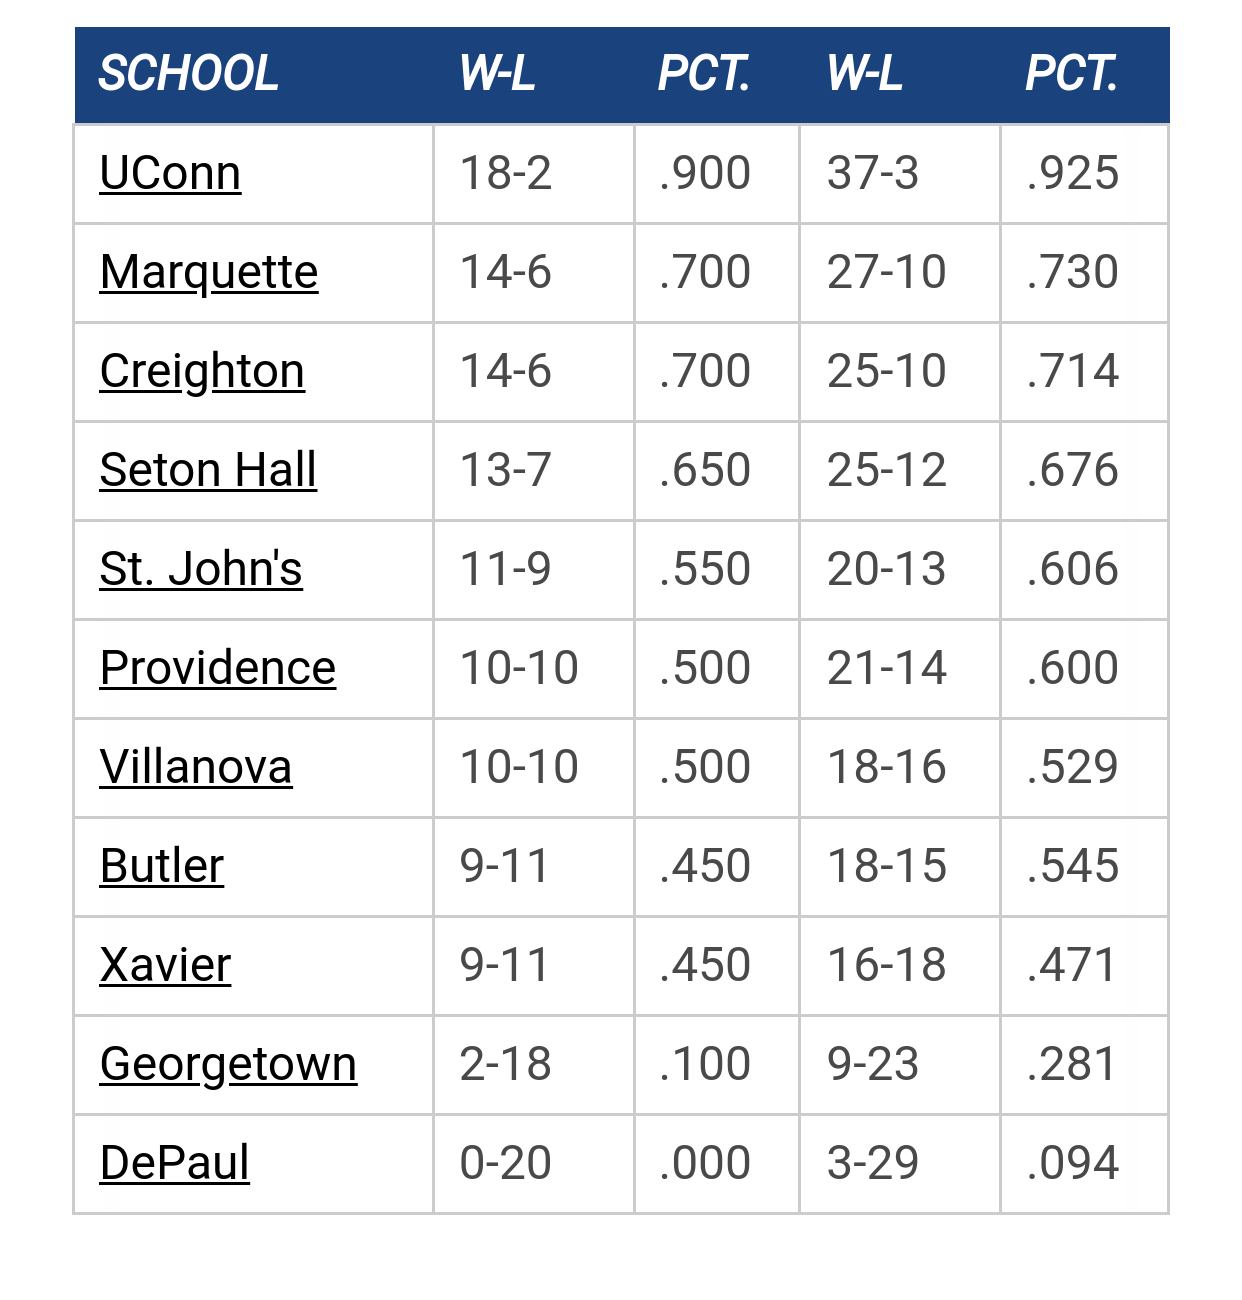
Big East Standings

Recent Posts

Big East 2024 -25 Results by Herman Cain
[Today at 05:57:33 PM]


Server Upgrade - This is the new server by THRILLHO
[Today at 05:52:28 PM]


Owens out Monday by TAMU, Knower of Ball
[Today at 03:23:08 PM]


Shaka Preseason Availability by Tyler COLEk
[Today at 03:14:12 PM]


Marquette Picked #3 in Big East Conference Preview by Jay Bee
[Today at 02:04:27 PM]


Get to know Ben Steele by Hidden User
[Today at 12:14:10 PM]


Deleted by TallTitan34
[Today at 09:31:48 AM]

Please Register - It's FREE!

The absolute only thing required for this FREE registration is a valid e-mail address. We keep all your information confidential and will NEVER give or sell it to anyone else.
Login to get rid of this box (and ads) , or register NOW!

Next up: B&G Tip-Off Luncheon

Marquette
Marquette

B&G Luncheon

Date/Time: Oct 31, 2024 11:30am
TV: NA
Schedule for 2023-24
27-10

By The Numbers: What are Close Losses?

Started by krocheck, January 31, 2011, 10:39:29 PM

Previous topic - Next topic

krocheck

Last season I set out to track Free Throws, specifically looking at MU making more than the opponent attempts. (http://www.muscoop.com/index.php?topic=18618.0)

This year I've taken a much broader approach to statistical analysis.  Taking over 15 different parameters of each game into account, I've been able to create a statistical ratio, a statistical score card to see how the games broke down beyond points on the board.  Ultimately PTS and FGs are the most important, so there is a weight in the score.  In the process, I've found that in our 8 losses, totaling 36 points (average of 4.5 ppl), some losses were close and others, it would seem, we were lucky to come out with a close score.

So, halfway through the Big East season and over two-thirds through the regular season ... here's where we're at.

Worst Loss: U Conn

Take a look at the box score and you will see that we were matched or beat in everything (fast break points and bench points are not scored).  Save us having an extra block and a better 3 Pt percentage, there is no conceivable reason we would have won this game.  Statistically, under my weighted system, they beat us 4 - 22 at a 0.18 statistical ratio (1 is a tie).

Next Worse Loss: Duke
8 - 24 / 0.33

Closest Loss: Wisconsin

This is really interesting game because the statistical score was 15 - 16 at a 0.94 ratio, a near tie.  Take, for instance, that the Badgers scored more buckets than us, however, we were more efficient with the shots we did take.  MU: 22-46 (47.7%), WIS: 26-47 (45.6 %).  MU lost the 3 pt battle, but won at the charity stripe.  The rest of the box score was roughly split 50/50 with a point or two extra going to the Badgers.  This 5 point loss was closer than the 5 other losses of 5 points or less.

2nd Closest Loss: Vanderbilt
12 - 18 / 0.67

Best Win: DePaul (duh!)
31 - 1 / 31.00

2nd Best Win: Mississippi Valley St.
27 - 2 / 13.50

2nd Best BE Win: Notre Dame
27 - 5 / 5.40

Closest Win: Syracuse

Take the Wisconsin game and turn the tables.  A 14 - 13 / 1.08 score.  The scoreboard was key, but the story of MU's edge was not in FGs, but at the line.  MU: 24-33 (72.7%), SYR: 8-14 (57.1%).  Both teams going 6 - 13 from 3 Pt land helped keep this one close.  MU had an edge in the Rebounds (O&D), Turnover, and Personal Foul categories with Syracuse taking Assists, Steals, and Blocks.  It was a close win statistically and on the scoreboard.

2nd Closest Win: South Dakota
20 - 12 / 1.67

MU vs. BE Opponents

StatMU TotOpp TotMU AvgOpp AvgGame W/L
Pts69564677.2271.785-4
FG264-555267-55347.6%48.3%4-5 (%); 4-5 (FGM)
3P69-16366-18242.3%36.3%5-3-1 (%); 3-3-3 (3PM)
FT174-248123-17670.2%69.9%6-3 (%); 7-2 (FTM)
REB28928432.1131.565-4
OREB1089112.0010.116-3
AST14715316.3317.004-5
STL52535.785.893-5-1
BLK25322.783.564-5
TO9211710.2213.005-2-2
PF15018616.6720.676-2-1
P10+33333.673.672-3-4
ATR1.601.315-4
PITP26227829.1130.893-5-1
POTO1409515.5610.565-3-1
SCP11710913.0012.115-3-1
FBP1028611.339.566-3
BP9213410.2214.893-6

Legend:
3P3-Point Field Goals
ASTAssists
ATRAssist to Turnover Ratio
BLKBlocks
BPBench Points
FBPFast Break Points
FGField Goals
FTFree Throws
OREBOffensive Rebounds
P10+Number of Players Scoring 10+ Points
PFPersonal Fouls
PITPPoints in the Paint
POTOPoint off Turnovers
PTSPoints
REBRebounds
SCPSecond (2nd) Chance Points
STLSteals
TOTurnovers


As with any stat, this is not a perfect science, but its fun more me to look beyond the score to find the strengths and weaknesses of MU.  When applied to last season the Villanova and ND close home losses scored as close wins.

Enjoy!

Keith

77ncaachamps

Compelling analysis of stats that suggest TO battle and PF/FT battles usually favor MU.

Great job!
SS Marquette

Dr. Blackheart

Thanks Keith...bench points really stand out...we lost our bench somewhere along the line.  Buzz has really shortened his bench and our subs are not very sure in BE play. 

One interesting box score to fold in may be largest leads and their time.  Having watched the UCONN and Wisky games, I never would have come to the same conclusions.  The Wisky game never was close, yet the UCONN game was--mainly because we didn't lead late in one and the other we did. 

Not that I am a glutton for punishment, but where did the Lville net out?

Thanks

mileskishnish72

Score to "fold" in - come on, Black, don't be cruel.

Dr. Blackheart

Quote from: mileskishnish72 on February 01, 2011, 08:05:34 AM
Score to "fold" in - come on, Black, don't be cruel.

My therapy has been going better since the SU game...I am more ready today to face the inner demons   :)

bamamarquettefan

Great stuff.  The two that really surprise me are that we have lost the steal battle in most games but won the turnover battle in most games.  Would have expected the reverse.

I do get assists.  Even though we are among the assist leaders in the country and seem to whip it around very well, I guess with the weaknesses in our defense and need to double and leave someone open that makes sense.  I guess every time Buycks or DJO drive to the hoop that's a bucket but not an assist.

But I think of us as a team that can get a little over aggressive and whip a pass out of bounds and has a stud playing out of position at point guard, so I think of us as high on turnovers, but the ones that go out of bounds.  I think of us as a team that turns up the heat and goes for steals and turns them into baskets, but the numbers don't quite bear that out.
The www.valueaddsports.com analysis of basketball, football and baseball players are intended to neither be too hot or too cold - hundreds immerse themselves in studies of stats not of interest to broader fan bases (too hot), while others still insist on pure observation (too cold).

krocheck

Quote from: Dr. Blackheart on February 01, 2011, 06:44:07 AM
Thanks Keith...bench points really stand out...we lost our bench somewhere along the line.  Buzz has really shortened his bench and our subs are not very sure in BE play. 

One interesting box score to fold in may be largest leads and their time.  Having watched the UCONN and Wisky games, I never would have come to the same conclusions.  The Wisky game never was close, yet the UCONN game was--mainly because we didn't lead late in one and the other we did. 

Not that I am a glutton for punishment, but where did the Lville net out?

Thanks
Louisville came out as the 4th worst loss with 10 - 21 / 0.48

I had looked into using the largest leads, but I didn't find a way to properly score it under this system.  I have other things that I've 'made up'.  I still have my columns to track the free throws like I did last year (which are not scored).  I might pull the P10+ stat, and not because MU is poor at it.  I want to build in something related to Rankings, but unsure of that as well.

With the WI and UConn games ... I watched them as well.  The stat sheet tells a different story at face value, however, I actually think the scoring properly snapshots the momentum of the game at the final buzzer (while also capturing the essence of the game).  Imagine if both of those games were played an additional minute or two.  The WI game we had the momentum to potentially close the gap more and even take the game ... time ran out.  The UConn game would probably be just as ugly as it was for the last few minutes ... no baskets, no momentum on MU's side.

There is quite a bit different between fighting through a game to stay alive and letting the wheels fall off in the last quarter.  A good effort will generally shine through a loss in the stats ... a poor effort (whether for part or whole) will skew the stats every time.

Keith