collapse

Resources

2024-2025 SOTG Tally


2024-25 Season SoG Tally
Jones, K.10
Mitchell6
Joplin4
Ross2
Gold1

'23-24 '22-23
'21-22 * '20-21 * '19-20
'18-19 * '17-18 * '16-17
'15-16 * '14-15 * '13-14
'12-13 * '11-12 * '10-11

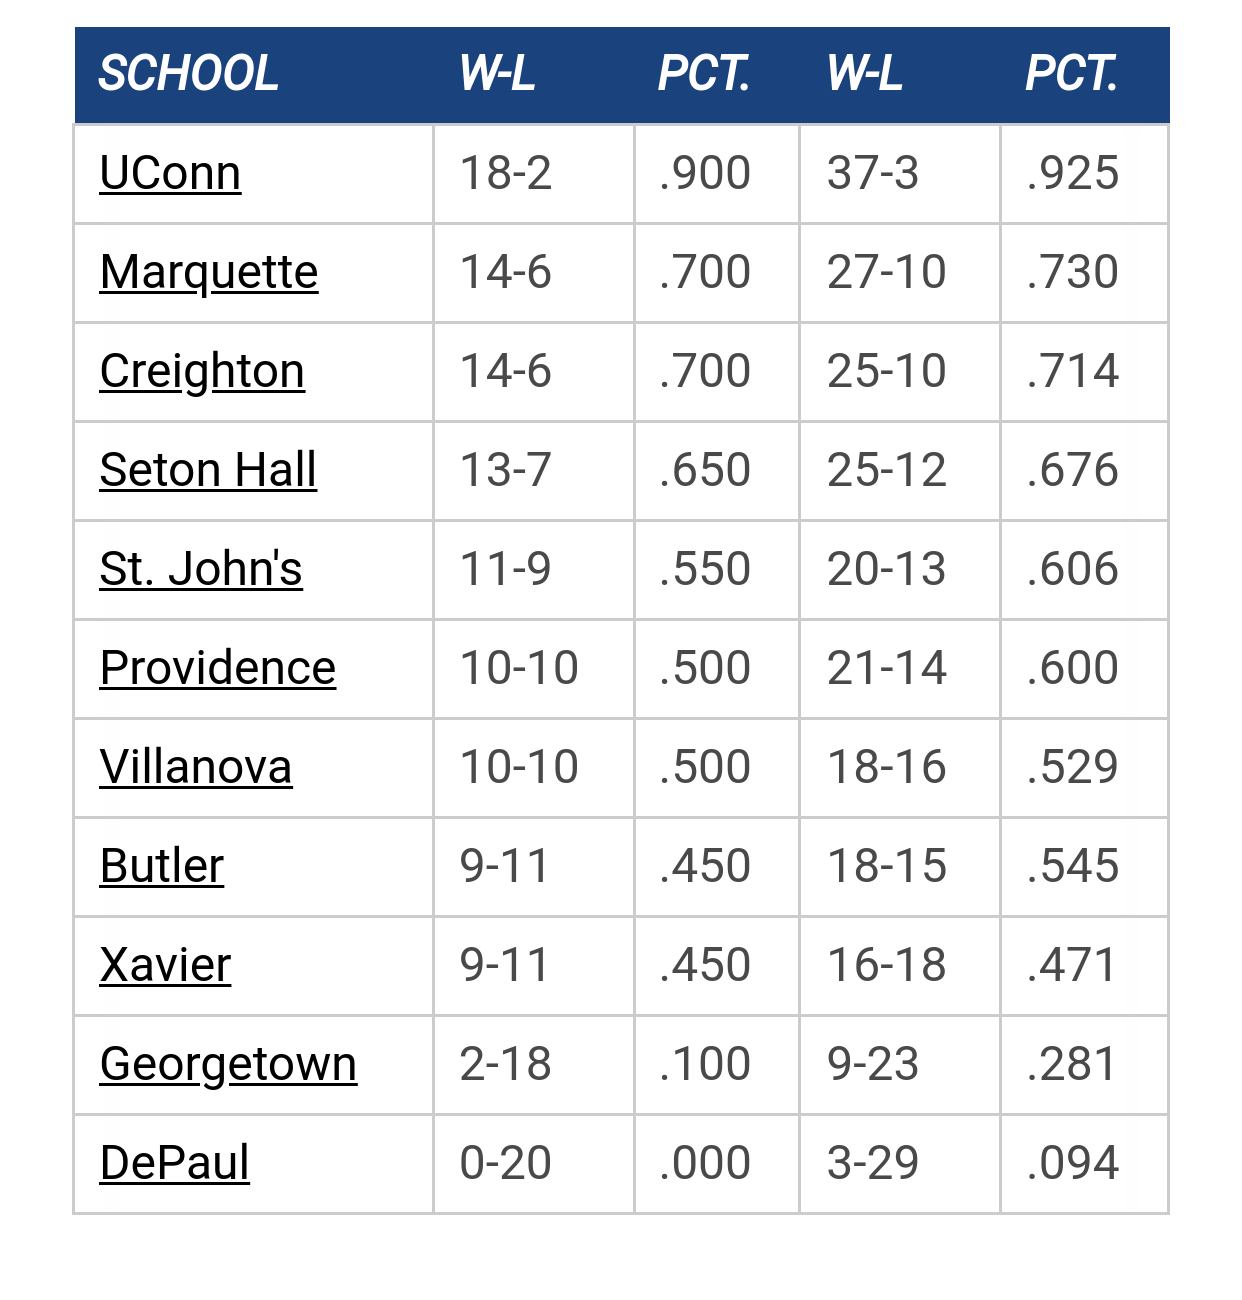
Big East Standings

Recent Posts

Recruiting as of 5/15/25 by MuMark
[Today at 03:56:31 PM]


NIL Money by BCHoopster
[Today at 11:56:37 AM]


Congrats to Royce by DoctorV
[May 24, 2025, 10:38:33 PM]


Let's talk about the roster/recruits w/Shaka by Jay Bee
[May 23, 2025, 08:31:14 PM]


Pearson to MU by Juan Anderson's Mixtape
[May 23, 2025, 08:12:08 PM]

Please Register - It's FREE!

The absolute only thing required for this FREE registration is a valid e-mail address. We keep all your information confidential and will NEVER give or sell it to anyone else.
Login to get rid of this box (and ads) , or signup NOW!

Next up: A long offseason

Marquette
66
Marquette
Scrimmage
Date/Time: Oct 4, 2025
TV: NA
Schedule for 2024-25
New Mexico
75

CrackedSidewalksSays

St. John's Numbers Recap

Written by: Henry Sugar

Due to the Steve Cottingham announcement and subsequent Cracked Sidewalks commentary, we're slightly delayed in producing the Numbers Recap for St. Johns.

Four Factors Review


In looking at the Four Factors, we actually found it somewhat surprising that St. John's ended up with a higher effective Field Goal Percentage (eFG%) than Marquette.  We're sure that it didn't help MU to finish with only one FG over the last ten minutes.  Marquette, as they do almost every single game, won the battle of turnover rates.  Sloppy play managed to force Marquette into a higher percentage than average (18.3%), but we were still below an average rate of 20%.  In addition, the strong recent play on the offensive boards continued.  This was one of Marquette's  non-conference strengths, but we faltered during early conference play.  However, MU has won this factor in five of our last six games, and our numbers continue to improve.

Finally, for St. John's to get a Free Throw Rate (FTR) of 93% is utter garbage.  Marquette is one of the worst teams in the country at allowing opponents to get to the line (ranking of 285), but that percentage is only at 42.6%.  93% is a number that is nearly twice the average rate of one of the lowest in the country, and it's not like Marquette was fouling excessively at the end in order to catch up.  Marquette's offensive FTR was also almost double our average figure of 26.2%. Maybe the refs should have swallowed those whistles a bit and "let them play".

Individual Player Review


We're going to take a look at the Individual Player Review by addressing some recent comments in Rosiak's Blog.  We've kind of been waiting for an opportunity to demonstrate that traditional stats may fall short, and his blog recap of St. John's is a nice chance.

Credit where it's due - Rosiak does a nice job giving credit to Mbakwe (1.4 net points - starting his streak of never again having a negative net contribution), McNeal (7.8 net points - mostly on the defensive end), and James (5.4 net points - higher than average Offensive Rating).  We'll look at James and McNeal a bit more below.

When traditional stats are misleading - However, Rosiak also says "-- Wesley Matthews attempted just four shots. He hasn't gotten into double figures since Jan. 26 against DePaul."  While this is technically true, it's also somewhat misleading.  Matthews was a net positive contributor to the game with the highest Offensive Rating on the team.  Since the DePaul game, despite being held below double figures, Matthews has had a net-positive contribution in every game except one.  This means that Wesley is finding lots of other ways to make a positive impact on the game without scoring.

In addition, Rosiak gives credit to Cubillan and Fitzgerald, even stating that "Dan Fitzgerald was highly productive in 19 minutes, finishing with five points, one rebound, one steal and one charge taken."  Granted... charges taken don't show up in the box score, but his overall impact on the game (-0.4) was essentially zero and not highly productive. Furthermore, Cubillan had the worst net contribution of the team (-1.7).

In general, we are big fans of Rosiak and we think he does a great job, but several of his comments were a clear indication of how traditional stats can be misleading.

A Two For One?


After we posted our Review of the Top Four, several blog comments referred to how similar the net contribution paths looked for James and McNeal.  Indeed, tracking from Providence to Cincy shows an almost identical trendline.  In addition, now that James appears to be back on track, the net contributions from McNeal have started to pick up again.  There's nothing definitive that proves the two are explicitly correlated, but the joint trends certainly do suggest that McNeal's production is boosted when James plays better.

This is just one more reason for optimism heading down the stretch... now that James is healthy, we appear to be getting more from Jerel again too.

http://www.crackedsidewalks.com/2008/02/st-johns-numbers-recap.html

Previous topic - Next topic