collapse

Resources

Stud of Albany Game

Chase Ross

15 points, 4 rebounds,
5 assists, 5 steals,
26 minutes

2025-26 Season SoG Tally
Ross1

'24-25 * '23-24 * '22-23
'21-22 * '20-21 * '19-20
'18-19 * '17-18 * '16-17
'15-16 * '14-15 * '13-14
'12-13 * '11-12 * '10-11

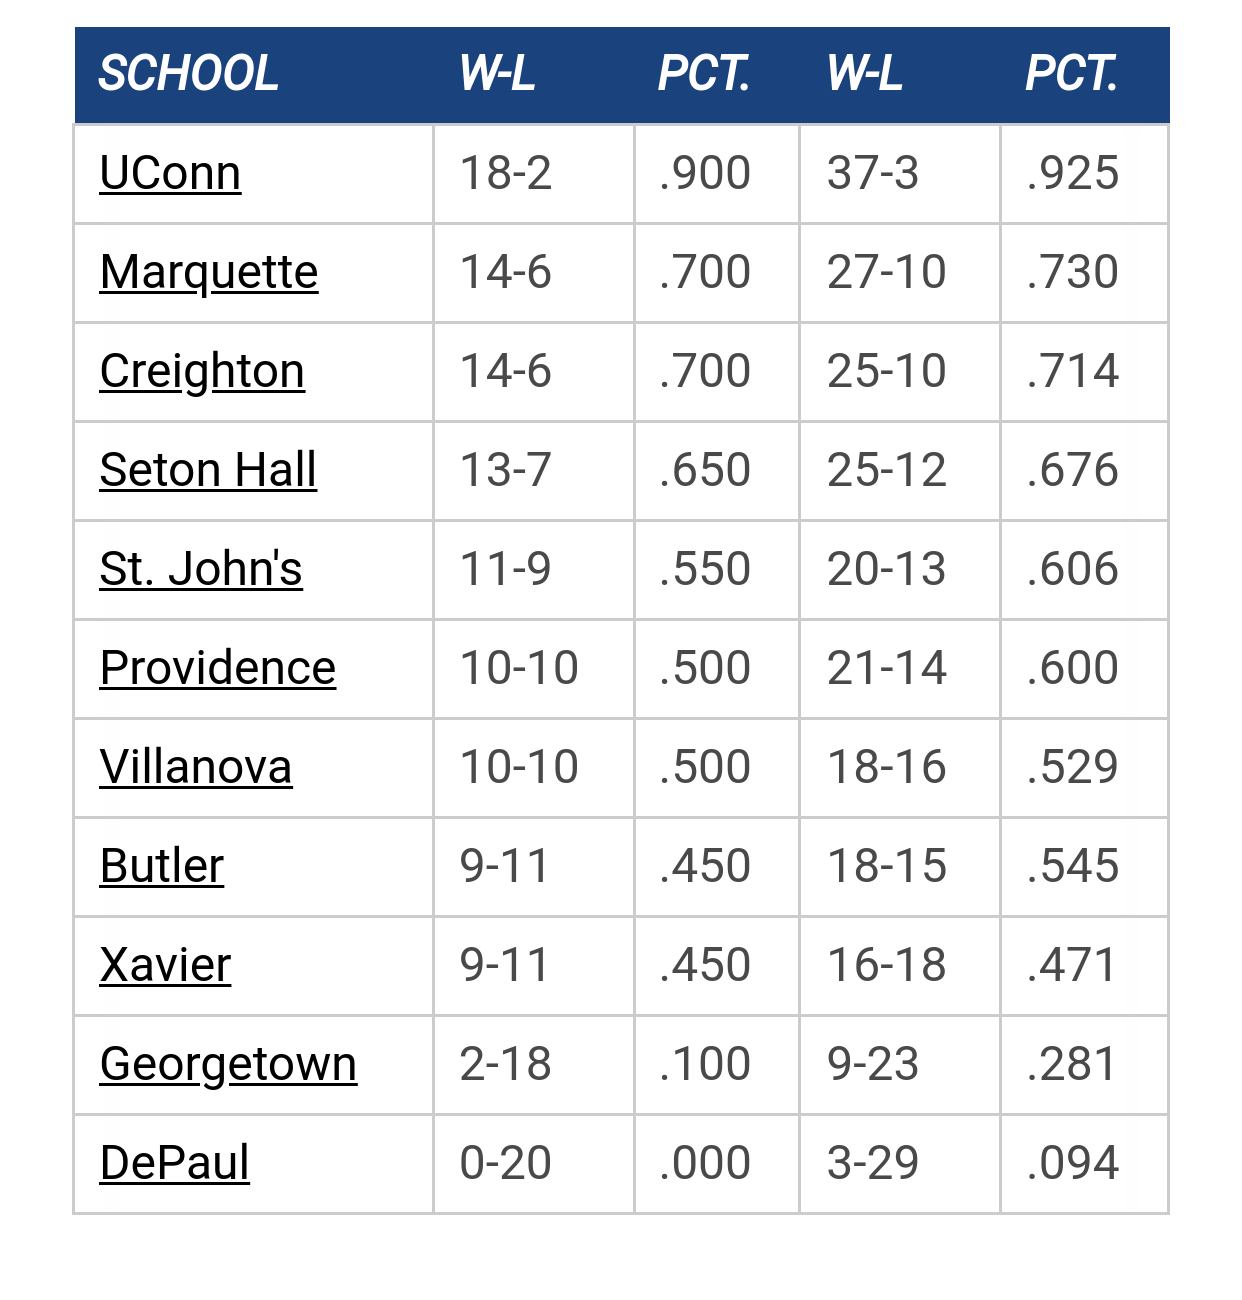
Big East Standings

Recent Posts

Jaguars are Evil by tower912
[Today at 04:53:53 PM]


Recruiting as of 9/15/25 by cheebs09
[Today at 04:31:08 PM]


Game day 2 by Scoop Snoop
[Today at 04:21:50 PM]


[Paint Touches] Marquette Minutes Projections for 2026 by Shooter McGavin
[Today at 04:21:33 PM]


MU's Team Speed by Uncle Rico
[Today at 03:49:30 PM]


Marquette NBA Thread by nyg
[Today at 02:41:47 PM]


2025-26 College Hoops Thread by Newsdreams
[Today at 02:16:10 PM]

Please Register - It's FREE!

The absolute only thing required for this FREE registration is a valid e-mail address. We keep all your information confidential and will NEVER give or sell it to anyone else.
Login to get rid of this box (and ads) , or signup NOW!

Next up: Southern

Marquette
80
Marquette vs.
Southern
Date/Time: Nov 5, 2025, 7:00pm
TV: ESPN+
Schedule for 2025-26
Albany
53

krocheck

Its a very prudent question to ask as we continue our journey in the NCAA's: what are Marquette's strengths and weaknesses this season.  In order to take a look at this we need to take a somewhat different look at the numbers; break them down by stat and game to find trends in how we perform during wins and losses.  Overall, Marquette has outperformed its opponents in every stat except 3 point shooting.

To do this I have a very powerful excel spreadsheet that lets us look not only at if we beat our opponent in a particular stat, but look at if that statistical win or loss followed the outcome of the game.  To make sense of this data is simple once you know what you're looking at.  You should be familiar with the total and average columns.  Win/Loss (W/L) shows MU's record in that stat on the season.  The rest are categories you will not be familiar with, because I think I'm the only one that tracks them to this level of detail.  Eff. Outcome (EO) is the effective game outcome, trying to see if the team that won the stat also won the game.  This is shown as:
Quote# of times the team that won the stat won the game : # of times the team that won the stat lost the game
The final column: Adj. Outcome (AO) adjusts the numbers to show only the times that Marquette won the stat but still lost the game.

Let's try this for a few so you get the hang of it.  The first stat is the number of points scored.  The W/L reflects MU's record.  EO and AO both show 35:0 since in this case the team that gets the most points always win the game.

Another ... Bench Points (BP).  BP shows a W/L of 21-14.  Coincidentally, that's the same as the team's record.  Reality, though, is that 12 times whichever team had the most bench points did not win the game.  Looking at the AO we see MU had 6 of those.  Conclusion to draw: while the stat seems to follow Marquette's record, the fact that 12 times it didn't show the winner and those were 50/50 wins and losses means this is not a key statistic as either a strength or weakness.

One more ... Free Throws (FT).  Looking at the FTM row, not the FT% row, we see Marquette 29-5-1 scoring more free throws then our opponents.  The EO shows that 9 times the team that scored more FT's did not win the game.  Further, the AO shows that all 9 of those were Marquette.  Conclusion to draw: Marquette has never won a game scoring fewer free throws then an opponent.  This is a clear weakness.  It shows a reliance on free throws, which we already knew.

The only additional piece of information you need to know about reading this data is that a tie in the stat is shown as a win for the team that won the game.  Blocks, as an example, show 8 ties between MU and the opponent during the season.  Those 8 ties are reflected in the 27 effective outcomes.  This means that only 19 times did the team that got the most blocks also win the game.  It is my opinion if you at least tie the stat you get the credit for the win, especially for a stat like blocks which doesn't show as much activity.  I may correct for this later on, but for now I think it works.

So, take a look at the numbers and see if you draw the same conclusions I do.

Statistic MU Total Opp Total MU Avg. Opp Avg. Win/Loss Eff. Outcome Adj. Outcome
Pts2653240375.8068.6621-1435:035:0
FG929-1980882-202118-1726:932:3
46.9%43.6%22-1330:532:3
2P745-1460632-132517-16-226:932:3
51.0%47.7%21-1429:632:3
3P184-520250-6966-24-521:434:1
35.4%35.9%14-19-222:1331:4
FT611-884389-59629-5-126:926:9
69.1%65.3%24-1120:1526:9
REB1357116935.9133.4019-1629:633:2
DREB83076223.7121.7719-14-230:533:2
OREB42740712.2011.6318-15-220:1528:7
AST55 53815.7415.3719-15-127:832:3
STL2502157.146.1417-14-422:1330:5
BLK1251193.573.4016-11-827:831:4
TO42349312.0914.0919-10-624:1130:5
PF59272616.9120.7428-5-228:728:7
P10+1231133.513.2314-12-930:534:1
ATR 1.301.0919-1625:1031:4
PITP1218101134.8028.8918-14-326:931:4
POTO58244316.6312.6620-14-123:1229:6
SCP44040512.5711.5717-16-223:1231:4
FBP46939513.4011.2922-12-123:1228:7
BP75357021.5116.2921-1423:1229:6
* a legend is at the bottom of the post

The first thing I see that field goal percentage and rebounds, specifically defensive rebounds, are the most important.  You would expect that anyway.  FG% shows that only 3 times this season did Marquette have a better FG% than our opponent but still loose.  2 times in the opposite direction.  Its important, but I'd like to focus on rebounds.  It is very clear to me that if we're getting out-rebounded that it is a recipe for disaster.  We out-rebounded @Georgetown (by 2) and vs. St. John's (by 1) but still lost.  We were out-rebounded @Milwaukee, @USF, @UConn (by 14!!), and vs. Xavier (by 4) yet still won.

My favorite stat to follow is the Number of Players Scoring 10 or more points (P10+).  Its a fun stat because it can help predict the game outcome, but its not an overall useful stat because it has the highest tie rate of any stat.  Looking my excel sheet I found that those 9 ties split 4-5 in MU's record.  The more telling data is that only once has Marquette lost this season while have more players in double digits than the opposition, however, we've won 4 ties when having less.  Its a good trend.  We know that the guys distribute the ball and everyone's scoring.  Only once have we been beaten at that game (@Georgetown  3-2).

@Georgetown was a weird game in some sense.  It was one of MU's lowest scoring games all season (@USF win 59-58, vs. Cincy loss 60-67, vs. Syr loss 56-81).  The Cincy loss we had 2 players in double digits, the rest had 3.  @Georgetown there were a lot of statistical splits, but Georgetown nearly tied us at the charity stripe (18-27 vs. 16-18) with 2 less scores, but a way better percentage, and both teams had 21 fouls.  I was talking about fouls and free throws as being a point of concern.  In half of our losses the opposition had either more Free Throws Made or a better Free Throw Percentage.  @Vanderbilt and vs. UConn were the only teams to get both.

I was hoping to have more time to analyze the data, however, I've been dealing with a work emergency for the last 24 hrs.  All settled now, but it killed my full analysis and I wanted to get this out before the game.

You can find the full breakdown by game and stat attached.  Enjoy!

Keith

Previous topic - Next topic