collapse

Resources

2024-2025 SOTG Tally


2024-25 Season SoG Tally
Jones, K.10
Mitchell6
Joplin4
Ross2
Gold1

'23-24 '22-23
'21-22 * '20-21 * '19-20
'18-19 * '17-18 * '16-17
'15-16 * '14-15 * '13-14
'12-13 * '11-12 * '10-11

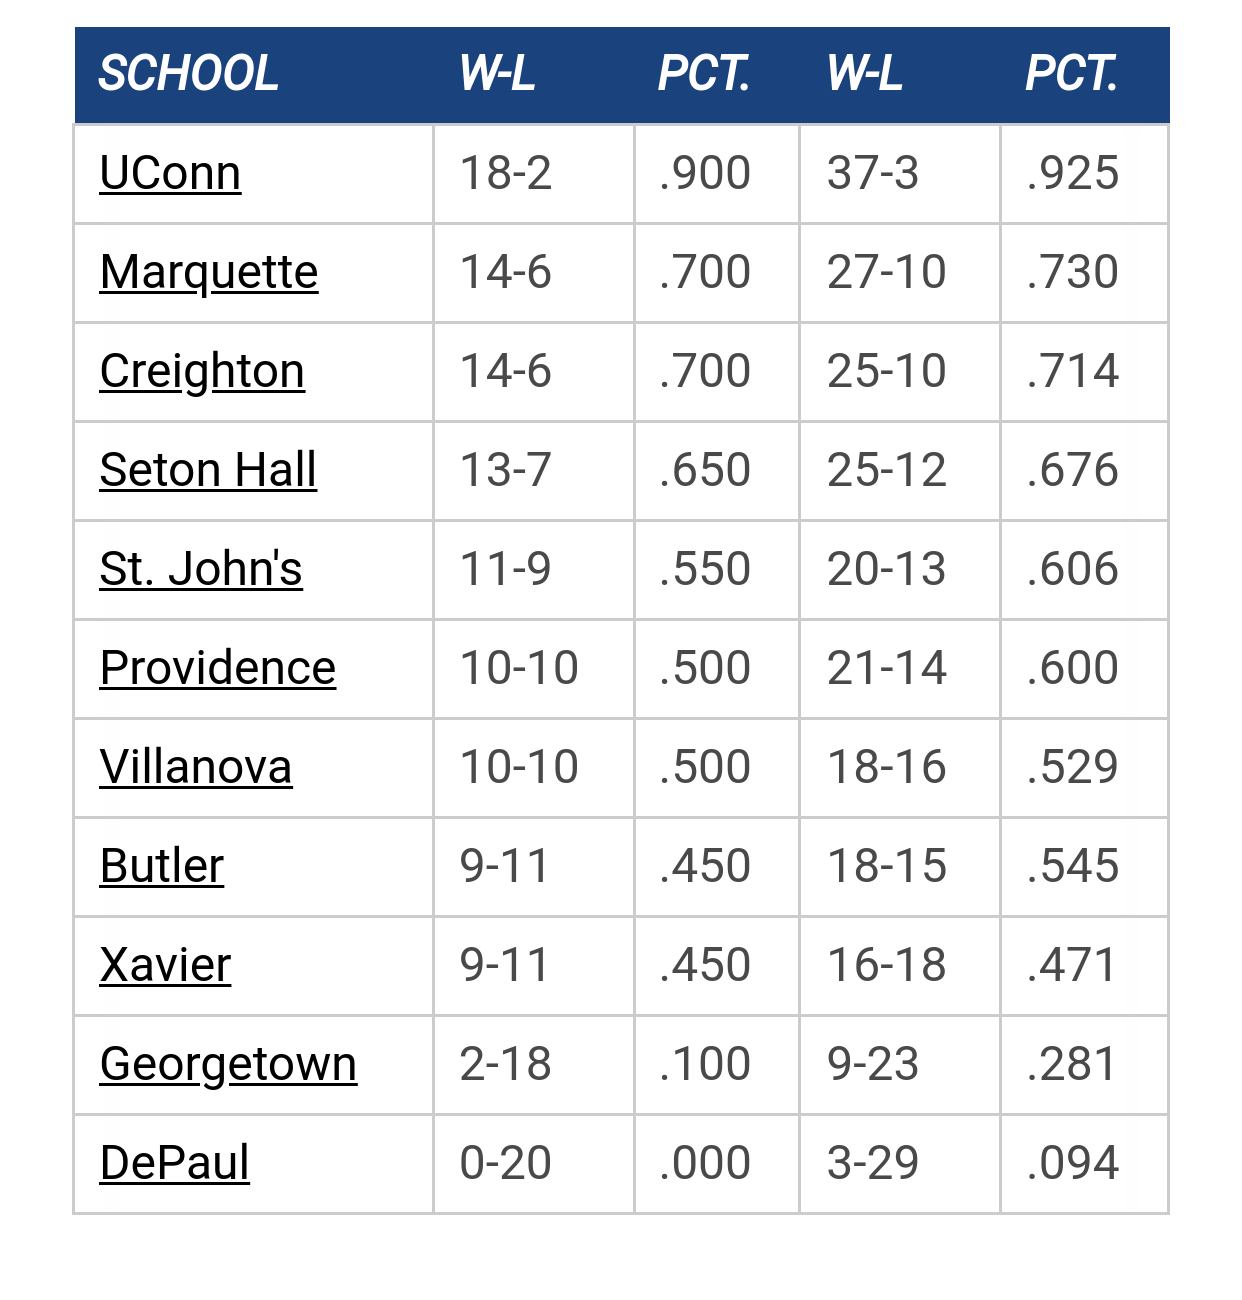
Big East Standings

Recent Posts

Recruiting as of 5/15/25 by Juan Anderson's Mixtape
[Today at 01:32:12 PM]


Kam update by Jockey
[Today at 12:30:31 PM]


To the Rafters by tower912
[June 28, 2025, 11:26:39 AM]


Regular season increase to 32 games by Uncle Rico
[June 28, 2025, 09:45:06 AM]


Marquette NBA Thread by Nukem2
[June 27, 2025, 04:35:30 PM]

Please Register - It's FREE!

The absolute only thing required for this FREE registration is a valid e-mail address. We keep all your information confidential and will NEVER give or sell it to anyone else.
Login to get rid of this box (and ads) , or signup NOW!

Next up: A long offseason

Marquette
66
Marquette
Scrimmage
Date/Time: Oct 4, 2025
TV: NA
Schedule for 2024-25
New Mexico
75

CrackedSidewalksSays

2008-2009 Recap - The Offense

Written by: noreply@blogger.com (Rob Lowe)

I've been breaking down the numbers associated with the season that just ended.  The point was trying to really understand what made Marquette go last year.

Before diving in too much, here's a quick look at the methodology.  First, I am only including the data against Top 100 opponents.  (Sorry, Presbyterian).  Second, a lot of the data that I'll track shows a moving 5-game average.  In other words, the trend will reflect the previous five games worth of data.

Let's break down the offense

Below are Marquette's season averages against the final Top 100 opponents compared against the Pomeroy full-season numbers (in italics).  None of this information should be a surprise, but it's helpful to recap.

Pace - 68.5 (vs Pomeroy 68.4)
eFG% - 50.1 (vs Pomeroy 51.2%, #85)
TO%  - 15.6 (vs Pomeroy 16.5%, #10)
OR%  - 30.9 (vs Pomeroy 34.8%, #97)
FTR  - 44.8 (vs Pomeroy 45.4, #12)

When we look at these figures,  two outstanding areas for Marquette really stand out.  First, not only was MU's ability to protect the ball great, but it was even better against the top 100 opponents.   Second, the team's ability to get to the free throw line was also consistently excellent.  Two areas where MU was only pedestrian (eFG% and OR%), however, did get worse against the better opponents.

Now that we know the performance of the squad on the key areas, how much did each area contribute towards offensive efficiency (and points per game)?

Efficiency Contribution (PPG Contribution)

Pace =  27.6 (18.9 ppg)
eFG% =  73.7 (50.5 ppg)
TO%  = -30.0 (-20.5 ppg)
OR%  =  28.8 (19.7 ppg)
FTR  =  10.1 (6.9 ppg)

What does this tell us?  Making a high percentage of shots was by far the greatest impact on points per game calculation. This, among other reasons, is why I tend to yell at the TV when I see a shot early in the clock or a long two .  Marquette's turnovers, being as good as they were at protecting the ball, still ended up costing the team about 20 points per game.  Marquette's offensive rebounds contributed about 20 points per game.  What really stands out to me, however, is that the much vaunted ability to get to the line only had a limited impact on points per game.

The marginal value of a Free Throw Attempt (and other things)

How much was a free throw attempt worth?  Or an offensive rebound, for that matter?

Average (Marginal Contribution)

68.5    possessions per game.  (Each possession worth 0.3 points.)
12 turnovers per game.  (Each turnover cost the team 1.7 points.)
12    offensive rebounds per game.  (Each offensive rebound worth 1.6 points)
27    free throw attempts per game.  (Each FTA worth 0.3 points.)

I left out field goals made because the math is based on making a percentage of field goals, and when I do the calcs it shows that a made field goal is worth 1.9 points.  Thinking of how to explain it makes my head hurt.

Anyways, think about these numbers in the context of various games.  MU beats St. Johns by only 14 points, with Lazar (five turnovers) and McNeal (four turnovers) coughing it up.  Jimmy Butler has ten offensive rebounds against Syracuse.  Wesley Matthews takes 18 FTA against Tennessee, out of 35 total MU FTA, and Marquette still loses by twelve with only 68 points.

Summary
Although Marquette's strengths were in the ability to protect the ball and get to the free throw line, it was actually their ability to make a high percentage of shots that played the biggest role in efficiency.  Unfortunately, this aspect of MU's game was not at an elite level.  Furthermore, although Marquette was able to get to the line at a high rate, the overall contribution to the team's success was minimal and may have been overemphasized.

In a subsequent post, I'll take a look at how Marquette's efficiency changed through the season, and try to understand which of the four factors played the biggest role in transitions.  eFG% will be biggest, as covered here, but what else changed during the season?


http://www.crackedsidewalks.com/2009/04/2008-2009-recap-offense.html

Previous topic - Next topic