collapse

* '23-'24 SOTG Tally


2023-24 Season SoG Tally
Kolek11
Ighodaro6
Jones, K.6
Mitchell2
Jones, S.1
Joplin1

'22-23
'21-22 * '20-21 * '19-20
'18-19 * '17-18 * '16-17
'15-16 * '14-15 * '13-14
'12-13 * '11-12 * '10-11

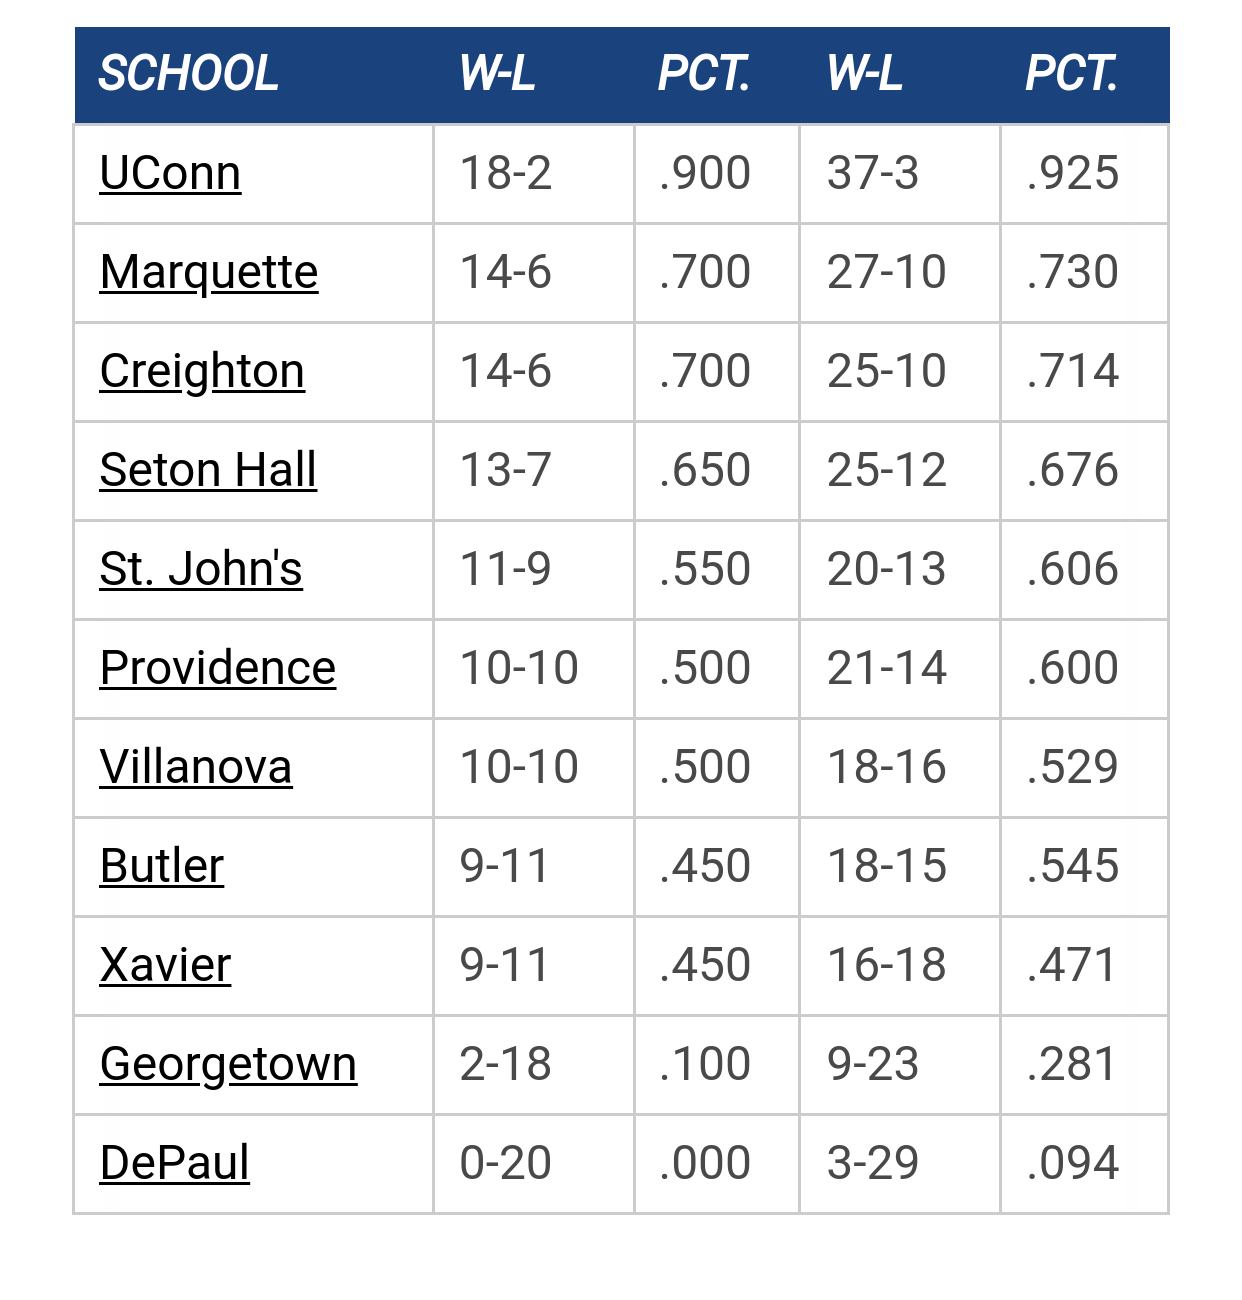
* Big East Standings

* Recent Posts

MU all-time defensive team? by mileskishnish72
[Today at 05:58:24 PM]


2024-25 Non-Conference Schedule by mileskishnish72
[Today at 05:50:19 PM]


Marquette NBA Thread by barfolomew
[Today at 05:19:49 PM]


Big East 2024 Offseason by MU82
[Today at 10:43:34 AM]

Please Register - It's FREE!

The absolute only thing required for this FREE registration is a valid e-mail address.  We keep all your information confidential and will NEVER give or sell it to anyone else.
Login to get rid of this box (and ads) , or register NOW!

* Next up: The long cold summer

Marquette
Marquette

Open Practice

Date/Time: Oct 11, 2024 ???
TV: NA
Schedule for 2023-24
27-10

Author Topic: [Cracked Sidewalks] Looking at the Top Four  (Read 946 times)

CrackedSidewalksSays

  • Guest
[Cracked Sidewalks] Looking at the Top Four
« on: February 14, 2008, 09:45:48 AM »
Looking at the Top Four

DISCLAIMER:  WARNING - STATS POST
(The following post digs further into some Basketball Stats.  You've been warned)

Rather than doing a numbers recap of the Seton Hall game, we're going to take an indepth look at the performance of Marquette's top four players during the Big EAST.  These Top Four are obviously  James, McNeal, Matthews, and Hayward.

Big EAST Stats


If you read the Numbers Recaps, a lot of this is what we cover on a game by game basis for individuals.  The only new information is Win %, which is a view of whether or not a player is a winning player based on their Offensive and Defensive Ratings.  Just like in all win percentages, 0.500 is average, meaning that the Offensive and Defensive Ratings are the same.
  • During Conference play, Marquette as a Team is averaging an Offensive Efficiency of 105.2 and a Defensive Efficiency of 101.5.  This is nowhere near as good as our full-season averages on Pomeroy's site, which should be no surprise.  The net points for our team is 48 during conference play, which means that for the entire Big East season, we've scored 48 more points (882) than our opponents have scored (834).  Our team's Expected Win% is 0.601 based on our offensive and defensive efficiencies.  Considering that we're barely above 0.500 in conference now (7-5), this makes sense.
  • Dominic James has a usage of 16.6%.  This means that 16% of the time, he consumes a possession either through a Free Throw Attempt, a Field Goal Attempt, or a Turnover.  James' Offensive Rating (ORtg) is largely aligned with the team's, and his defensive rating is a little worse than the team's average.  Both ORtg and DRtg come from Dean Oliver's Basketball on Paper.  Pomeroy (link above) also tracks per-player Offensive Ratings.  During the Big East, James has contributed about 10 net points.  This means that of all the points he has contributed, the net impact has been plus ten.  Remember that the entire team has only 48 net points.  James' winning percentage is a little bit above 0.500 (more on this later)
  • Jerel McNeal has the highest usage on the team during conference play.  He is consuming almost 20% of all team possessions.  However, his ORtg is well below the team average.  Even though his DRtg is better than team average, it's not low enough to account for the misfires on offense.  High usage + Low ORtg is bad.  McNeal, in spite of this, has 3 net points for conference play.  However, looking at his Win% 0f 0.250, McNeal has not been a winning player during conference play. He's hurting the team with his low Offensive Rating and high usage.
  • Wesley Matthews is getting it done on the Offensive end.  His ORtg has been much higher than team averages during conference play.  This gives Wesley 13.8 net points, meaning that he is providing about 30% of our net points.  Matthews also has an individual Win % of 0.794, which is better than the team Expected Win%.
  • However, Lazar Hayward has the best Win% of the four at 0.812.  His ORtg and DRtg are better than the team averages, and he's chipped in 33.6 net points.  Hayward really deserves consideration for most improved in the Big East.  He is easily our most valuable statistical contributor.  It's going to be fun watching him for the next few years.
In summary, the individual contributions reflect that reality for the entire team.  After all, the team is 7-5 in conference, so it's to be expected that individual results aren't that great.  Hayward and Matthews have been the consistent team leaders during conference play.  However, James is marginal in his conference contributions, and McNeal is not a winning player!

Is there anything in their cumulative point trends that helps provide more insight?


Cumulative point graphs show how a player is trending.  Upward slopes are trends of consistent positive contributions to games, and downward trends are consistent negative impacts on games.  In the cumulative points graph, we can see exactly how valuable Hayward has been.  His contribution slope is just steady and upwards.  Essentially, his only negative net games were against Louisville and Louisville.  Matthews has been steady and on a gradual rise, albiet unspectacular.


One can look at the above graph for James with the image of Nutter's first flagrant foul in your mind.  This cumulative points graph shows that James has had a downward slope since the first Seton Hall game (minus the ND uptick).  Now that Dominic appears to be healthy again, his contributions are on the rise.  Before he was injured, James was easily the most valuable statistical contributor on the team. Since James now appears healthy, we can look for his and the team's improvement.

McNeal is the real puzzler.  What has happened with last year's Team MVP?  In 06-07, McNeal accounted for 161 net points, but he's currently only around 60, and almost all of those contributions were in non-conference.  In addition, it's the inconsistency from McNeal that is jarring, with a graph that bounces up and down.  For Marquette to have the success everyone wants, we need the McNeal that was around last year or for him to take less shots.  I guess, if we're looking for hope, one can see a general trend for McNeal of better contributions starting around the DePaul game.

Conclusion
The Big Four account for the majority of our team's possessions as well as our success.  Hayward  has been a stud all season and has really proven to be invaluable.  After a slow non-conference start, Matthews has had a net-positive overall contribution.  While James had a slump, which we attribute mostly to his injury, he appears to have started to rebound.  However, last year's team MVP needs to get back on track or defer to others more if Marquette desires to do well for the rest of the season.


http://www.crackedsidewalks.com/2008/02/looking-at-top-four.html

1990Warrior

  • Team Captain
  • ****
  • Posts: 388
Re: [Cracked Sidewalks] Looking at the Top Four
« Reply #1 on: February 14, 2008, 10:00:46 AM »
It would be interesting, especially in the case of McNeal, to know the in conference stats from last year.

Henry Sugar

  • Registered User
  • All American
  • *****
  • Posts: 2007
  • There are no shortcuts
    • Cracked Sidewalks
Re: [Cracked Sidewalks] Looking at the Top Four
« Reply #2 on: February 14, 2008, 10:16:36 AM »
Agreed.  It would be interesting.  Unfortunately, I don't have that info and I'd have to manually enter the box scores for 16 games and create all new calcs.  It's a non-trivial effort.

I may get to it at some point during the offseason, but all we have now is the full season stats for last year (and 05-06).
A warrior is an empowered and compassionate protector of others.


feedback