collapse

Resources

2024-2025 SOTG Tally


2024-25 Season SoG Tally
Jones, K.10
Mitchell6
Joplin4
Ross2
Gold1

'23-24 '22-23
'21-22 * '20-21 * '19-20
'18-19 * '17-18 * '16-17
'15-16 * '14-15 * '13-14
'12-13 * '11-12 * '10-11

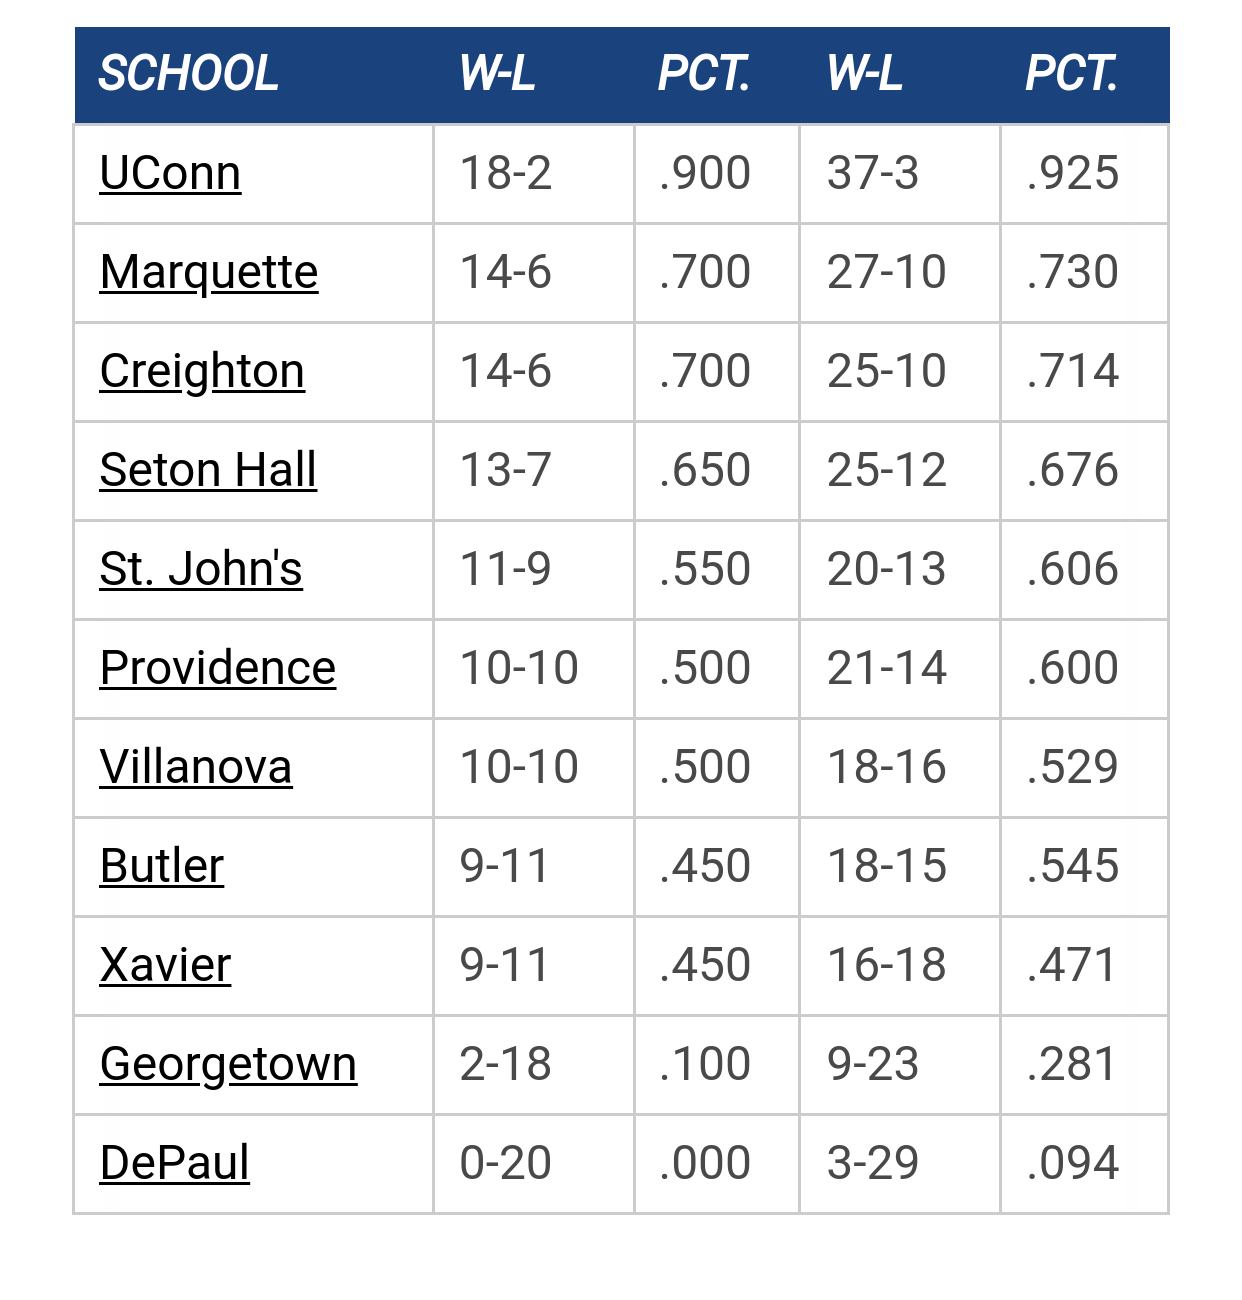
Big East Standings

Recent Posts

NIL Money by MU82
[Today at 09:44:26 PM]


Kam update by MarquetteMike1977
[Today at 08:26:53 PM]


Brad Stevens on recruit rankings and "culture" by MU82
[Today at 04:42:00 PM]


2025 Coaching Carousel by MarquetteBasketballfan69
[Today at 12:15:13 PM]


ESPN's Way Too Early Poll by BM1090
[May 04, 2025, 11:52:59 PM]


Recruiting as of 4/15/25 by MuMark
[May 04, 2025, 04:23:25 PM]


Perspective 2025 by Jay Bee
[May 04, 2025, 03:26:55 PM]

Please Register - It's FREE!

The absolute only thing required for this FREE registration is a valid e-mail address. We keep all your information confidential and will NEVER give or sell it to anyone else.
Login to get rid of this box (and ads) , or signup NOW!

Next up: A long offseason

Marquette
66
Marquette
Scrimmage
Date/Time: Oct 4, 2025
TV: NA
Schedule for 2024-25
New Mexico
75

CrackedSidewalksSays

Seton Hall Numbers Recap

In our Seton Hall Preview, we said to look at Free Throw Rate for both teams, how many turnovers MU was able to force, and to expect Marquette to score easily and often through a quick pace.

Yeah, almost none of those things happened, mostly due to Seton Hall's 3-2 zone defense. As has already been recapped by CS, this was an ugly game.

Looking at the four factors, Marquette should feel fairly lucky to have won. Seton Hall did better on Turnovers, Offensive Rebounding, and Free Throw Rate, and only allowed a slight difference to MU on Field Goal Percentage. Marquette averages an Offensive Efficiency of 118.7, and Seton Hall held Marquette to their worst Efficiency of the season. On the flip side, Marquette was able to force Seton Hall into more Turnovers than they usually commit, and held them under their standard Free Throw Rate.

Disturbing Trend or Fatigue?

For the second game in a row, Marquette was held to a season worst in Offensive Efficiency and effective Field Goal Percentage. Marquette's previous worst in Offensive Efficiency was 101.7 against West Virginia. Marquette's previous worst in in eFG% was 48.3%. MU ended up well below both of these figures, which were already season lows. In addition, for the second game in a row, Marquette ended up with Offensive Rebounding figures that were well below our average. At one point, our Offensive Rebounding Percentage was #7 out of all Division 1 schools, but that number has since fallen.

Is this a trend where our team's offensive and defensive efficiency return to normal after a season of cupcakes? Or, is this just an instance of Marquette playing three games in six days, including a tough matchup in Morgantown? Frankly, there's just not enough data, but Cracked Sidewalks will be concerned if trends continue against Notre Dame.

Individual Ratings

Key contributors to the game for Marquette were Dominic James and Jerel McNeal. The numbers for McNeal are a clear example of how he contributes through different means. Despite going 6-17 and having six turnovers, McNeal had a positive contribution through his other stat stuffers of seven rebounds, five assists, three blocks, and two steals. Both of our centers made their contributions on the defensive end, but weren't able to generate any offense.

Notre Dame is coming to town this Saturday. This will be a very tough test for Marquette.
http://www.crackedsidewalks.com/2008/01/seton-hall-numbers-recap.html

Previous topic - Next topic