collapse

Resources

2024-2025 SOTG Tally


2024-25 Season SoG Tally
Jones, K.10
Mitchell6
Joplin4
Ross2
Gold1

'23-24 '22-23
'21-22 * '20-21 * '19-20
'18-19 * '17-18 * '16-17
'15-16 * '14-15 * '13-14
'12-13 * '11-12 * '10-11

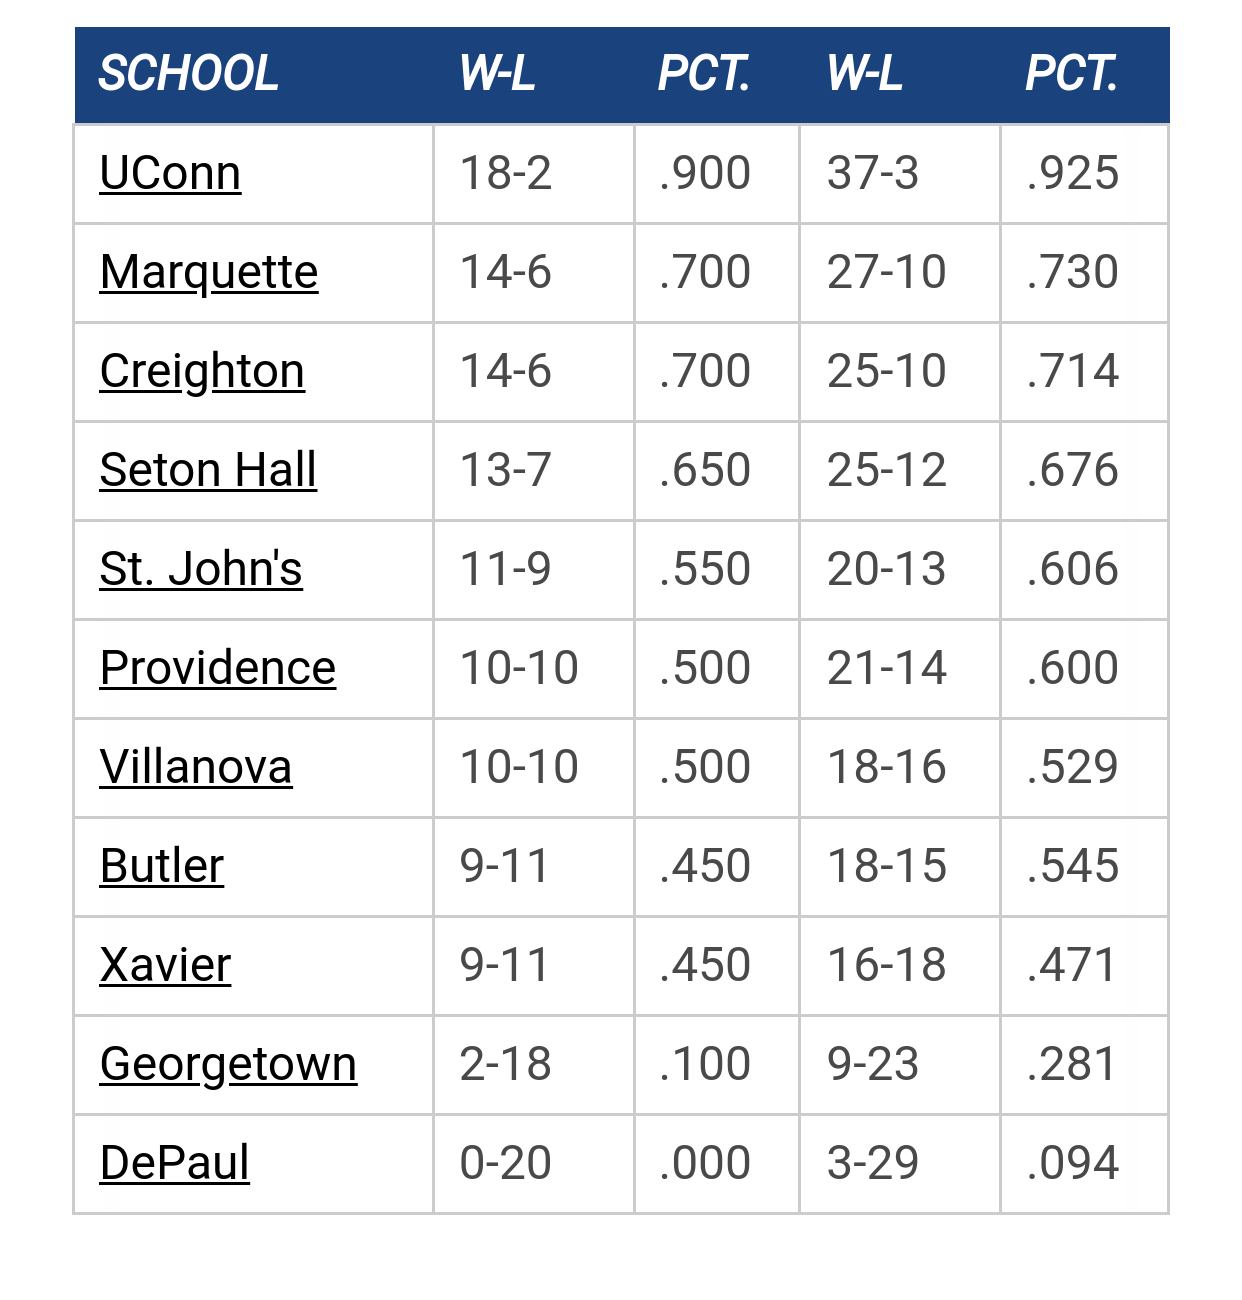
Big East Standings

Recent Posts

Kam update by We R Final Four
[Today at 05:47:36 PM]


What is the actual gap between Marquette and the top of the Big East by BCHoopster
[Today at 05:46:32 PM]


Marquette NBA Thread by Skatastrophy
[Today at 05:29:38 PM]


Recruiting as of 5/15/25 by ATL MU Warrior
[Today at 04:46:07 PM]


2026 Bracketology by ATL MU Warrior
[Today at 04:43:28 PM]


2025 Transfer Portal by wadesworld
[Today at 04:31:57 PM]


Pearson to MU by We R Final Four
[Today at 04:13:02 PM]

Please Register - It's FREE!

The absolute only thing required for this FREE registration is a valid e-mail address. We keep all your information confidential and will NEVER give or sell it to anyone else.
Login to get rid of this box (and ads) , or signup NOW!

Next up: A long offseason

Marquette
66
Marquette
Scrimmage
Date/Time: Oct 4, 2025
TV: NA
Schedule for 2024-25
New Mexico
75

CrackedSidewalksSays

Charity Ice

Written by: noreply@blogger.com (Tim Blair)

Dr. Blackheart is back for more .... here's the latest in his on-going series of guest columns which look in-depth at the Warriors on a variety of topics.

*****************************************
As our Feared Warriors march into the post-season tournaments with only “do or die” games remaining, the chance that these games will be decided by free throws will be very likelyâ€"as seen in our last four NCAA games which were decided by a total of eight points.  Due to the nature of this sudden death, the topic  of free throw shooting always is a controversial one this time of year as a missed charity shot at the end is “oh so” immediate.  This controversy has percolated from time to time during the season as well as Buzz has stated that he does not spend formal practice time on free throw shooting.

As a result of all of this, I dug into this issue to get the discussion agenda going as MU heads into the Big East Tournament and beyond.

Buzz’s Teams Making MU History
At the close of this regular season, Buzz’s first three teams combined have the best free throw shooting percent in MU’s recorded history at 72.1%.  This is a little less than 4% points higher than MU’s average over the past 63 years.  This is contra to the trend in the NCAA and NBA which have seen virtually no change in free throw shooting percents over the past 50 years.  Obviously, this is a point on the board for Buzz’s philosophy in this endless and emotionally charged debate as he is going against Hall of Fame coaches on this list.  Certainly 24/7/365 player access to “The Al” has also helped in this regard.

     Normal   0         false   false   false                             MicrosoftInternetExplorer4           /* Style Definitions */  table.MsoNormalTable  {mso-style-name:"Table Normal";  mso-tstyle-rowband-size:0;  mso-tstyle-colband-size:0;  mso-style-noshow:yes;  mso-style-parent:"";  mso-padding-alt:0in 5.4pt 0in 5.4pt;  mso-para-margin:0in;  mso-para-margin-bottom:.0001pt;  mso-pagination:widow-orphan;  font-size:10.0pt;  font-family:"Times New Roman";  mso-ansi-language:#0400;  mso-fareast-language:#0400;  mso-bidi-language:#0400;}    
  [color=black;">Coach

]   [td]   [color=black;">FTA

]   [td]   [color=black;">FTM

]   [td]   [color=black;">FT]  
  [color=black;">Tex

]   [td]   [color=black;">1223

]   [td]   [color=black;">1819

]   [td]   [color=black;">67.2%

]  
  [color=black;">Nagle

]   [td]   [color=black;">2635

]   [td]   [color=black;">3876

]   [td]   [color=black;">68.0%

]  
  [color=black;">Hickey

]   [td]   [color=black;">2392

]   [td]   [color=black;">3712

]   [td]   [color=black;">64.4%

]  
  [color=black;">McGuire

]   [td]   [color=black;">6042

]   [td]   [color=black;">8914

]   [td]   [color=black;">67.8%

]  
  [color=black;">Raymonds

]   [td]   [color=black;">2258

]   [td]   [color=black;">3236

]   [td]   [color=black;">69.8%

]  
  [color=black;">Majerus

]   [td]   [color=black;">1236

]   [td]   [color=black;">1822

]   [td]   [color=black;">67.8%

]  
  [color=black;">Dukiet

]   [td]   [color=black;">1121

]   [td]   [color=black;">1626

]   [td]   [color=black;">68.9%

]  
  [color=black;">O]     [color=black;">2231

]   [td]   [color=black;">3136

]   [td]   [color=black;">71.1%

]  
  [color=black;">Deane

]   [td]   [color=black;">2145

]   [td]   [color=black;">3235

]   [td]   [color=black;">66.3%

]  
  [color=black;">Crean

]   [td]   [color=black;">4289

]   [td]   [color=black;">6031

]   [td]   [color=black;">71.1%

]  
  [color=black;">Williams

]   [td]   [color=black;">1704

]   [td]   [color=black;">2362

]   [td]   [color=black;">72.1%

]  
  [color=black;">Total]     [color=black;">     [color=black;">     [color=black;">68.5%

]  

2010-11 Season Strong[/color]
This season’s team is ranked at 154 according to Pomeroy in free throw shooting at 69.8%, a few decimal points above the national mean of 69.2%.  In Big East play, MU is shooting an improving 70.1%, good for 8th in league play.  MU leads the BE is both free throws attempted and made, which is a reflection of Buzz’s paint touch offensive philosophy.  In support of the fact that MU’s offense is the 14th most efficient nationally and that MU scored the most points per game of any Big East team, Buzz earns another point, as MU’s opponents only shot 65.8% against us (69.0% for the Big East foes).

     Normal   0         false   false   false                             MicrosoftInternetExplorer4           /* Style Definitions */  table.MsoNormalTable  {mso-style-name:"Table Normal";  mso-tstyle-rowband-size:0;  mso-tstyle-colband-size:0;  mso-style-noshow:yes;  mso-style-parent:"";  mso-padding-alt:0in 5.4pt 0in 5.4pt;  mso-para-margin:0in;  mso-para-margin-bottom:.0001pt;  mso-pagination:widow-orphan;  font-size:10.0pt;  font-family:"Times New Roman";  mso-ansi-language:#0400;  mso-fareast-language:#0400;  mso-bidi-language:#0400;}    
  [color=black;">]
  [color=black;">FTA

]   [td]   [color=black;">FTM

]   [td]   [color=black;">FT]  
  [color=black;">MU]     [color=black;">547

]   [td]   [color=black;">784

]   [td]   [color=black;">69.8%

]  
  [color=black;">OPP]     [color=black;">354

]   [td]   [color=black;">538

]   [td]   [color=black;">65.8%

]  
  [color=black;">MU]     [color=black;">324

]   [td]   [color=black;">462

]   [td]   [color=black;">70.1%

]  
  [color=black;">BE]     [color=black;">238

]   [td]   [color=black;">345

]   [td]   [color=black;">69.0%

]  

Crunch Time Blues[/color]
In the recently published book Scorecasting, the authors dug into various sports’ myths including the impact of icing a placekicker or free throw shooter in pressure situations.  They looked at reams of play-by-play data and found icing does not[/color] work:  â€œIcing doesn’t freeze a player or heat them up.  You might call it a lukewarm strategy[/color].”

Curious, I mined this season’s play-by-play data to see how these situations look for our Warriors, who are relatively inexperienced to pressure play.  I segmented play into two buckets when the pressure of free throws is seemingly greater and players are more fatigued:  1) the last two minutes of the game and OT and 2) the last four minutes.  What I found was a bit surprising, and actually fairly consistent across the games.
  • Despite shooting at a near 70% clip, MU shooters tightened up at the end of games.  This has been especially true in Big East games (50% free throw shooting).  More so, MU is an abysmal 40% on the road in BE play and a lackluster 60% at home.
  • Our opponents, who shot below the national average in the games against MU, stepped it up considerably at crunch time.  In fact, our BE enemies shot a whopping 83.3% in the last two minutes of games, an increase from 69%.
  • Excluding the crunch time data, MU shot at 73% for the rest of the game in Big East play, which would put this team at the average of Buzz’s first two experienced teams and just off the BE team lead.  Our BE opponents shot a paltry 65% for the remaining majority of the games.  One point against Buzz’s philosophy he again adopted for this season's inexperienced players.
    Normal   0         false   false   false                             MicrosoftInternetExplorer4           /* Style Definitions */  table.MsoNormalTable  {mso-style-name:"Table Normal";  mso-tstyle-rowband-size:0;  mso-tstyle-colband-size:0;  mso-style-noshow:yes;  mso-style-parent:"";  mso-padding-alt:0in 5.4pt 0in 5.4pt;  mso-para-margin:0in;  mso-para-margin-bottom:.0001pt;  mso-pagination:widow-orphan;  font-size:10.0pt;  font-family:"Times New Roman";  mso-ansi-language:#0400;  mso-fareast-language:#0400;  mso-bidi-language:#0400;}    
  [color=black;">]
  [color=black;">Free]  
  [color=black;">]
  [color=black;">Last]     [color=black;">Last]  
  [color=black;">Marquette

]   [td]   [color=black;">]
  [color=black;">]
  [color=black;">All]     [color=black;">60.2%

]   [td]   [color=black;">63.0%

]  
  [color=black;">BE]     [color=black;">50.0%

]   [td]   [color=black;">55.6%

]  
  [color=black;">BE]     [color=black;">60.0%

]   [td]   [color=black;">61.5%

]  
  [color=black;">BE]     [color=black;">40.0%

]   [td]   [color=black;">50.0%

]  
  [color=black;">Opponents

]   [td]   [color=black;">]
  [color=black;">]
  [color=black;">All]     [color=black;">77.0%

]   [td]   [color=black;">74.8%

]  
  [color=black;">BE]     [color=black;">83.3%

]   [td]   [color=black;">78.7%

]  

Outlook[/color]
Tired legs and shaky nerves lay ahead.  As we saw at Seton Hall, Buzz will have to go deeper into his bench to save energy.  But, at crunch time, let’s get the ball into Jimmy Butler’s hands who is 10th in Big East and who has been in the pressure cookers before.  Go MU!

“Share the Tagamet”

http://www.crackedsidewalks.com/2011/03/charity-ice.html

Tugg Speedman

Good job (read the version on CS as it's formatted properly).

What do the last four and two minutes FT% look like without the USF game?  Didn't we miss seven in a row down the stretch of that game?

Why exclude?  Because I want to see if this outlier, which we won, is skewing your data.

Dr. Blackheart

Win or lose...they tighten up--except JFB.  Here are some closer games that were on the line (good and bad). Numbers are the last two minutes:

UWM:  7-8, Bucknell: 6-11, Duke: 3-4, Zags: 0-0, Rutgers: 4-10, UL: 1-2, Gtown: 0-2, SH Away:  1-2, SH Home: 2-4, UND Away:  0-1, UConn Home:  3-4, UConn Away: 4-4, UC: 2-4.  And of course 0-7 USF.

This is generally consistent in all games, close or not.  And in the last four minutes. I think we can safely say this is true on offense in general as we have discussed in other threads.

To add to this, I did a quick correlation of Pomeroy's experience stat to 1) BE Winning % and 2) Free Throw %. For the record, MU's experience rank is 9th in the BE and 135th nationally.  Considering that three starters never played or had very limited BE minutes and Blue, Gardner, EWills get some minutes, you could argue MU is greener than that.  Anyway, the correlations are fairly strong. Experience rank to Free throw shooting is about .40 but goes up to .60 if you exclude UConn where the experienced stud Walker controls the possessions--not their frosh. Winning percent to experience rank is also strong at similar levels.  

SJU is 4th nationally in experience, UND is 15th, WVU is 21st...and SH is 60th, for example.  They have been there, MU hasn't yet. Trial by fire.  Experienced guards all.

Tugg Speedman

#3
I made a quick table of these numbers.  You have the Vandy and Wisc games?

It visually says what you say, our FT% goes down late in the game, win or lose, USF counted or not.  And I completely agree with your correlation that it's more about the number of experienced players and not practice schemes to simulate the end of a game.  More seniors, more players with dozens of starts over many years, better FT%.  More freshman, more players just getting PT, worse FT%

FTs in the last two minutes of the game

Win/Loss     Game     FTM      FTA   FT%
W             UMM          7      8           87.5%
W             Bucknell       6      11           54.5%
L             Duke           3      4           75.0%
L            Zags               0      0           n.a.
W            Rutgers       4      10           40.0%
L            UL               1       2           50.0%
L            Gtown         0       2           0.0%
L            SH Away       1       2           50.0%
W            SH Home       2       4           50.0%
L            ND Away       0       1            0.0%
L            Uconn Home   3       4           75.0%
W            Uconn Away   4      4           100.0%
L            Cincy             2      4           50.0%
W            USF               0     7           0.0%
   Total                         33     63      52.4%
   Total Less USF           33        56   58.9%
   All Wins Above             23   44   52.3%
   Wins Less USF             23   37   62.2%
   All Losses Above         10   19   52.6%

Previous topic - Next topic