collapse

* '23-'24 SOTG Tally


2023-24 Season SoG Tally
Kolek11
Ighodaro6
Jones, K.6
Mitchell2
Jones, S.1
Joplin1

'22-23
'21-22 * '20-21 * '19-20
'18-19 * '17-18 * '16-17
'15-16 * '14-15 * '13-14
'12-13 * '11-12 * '10-11

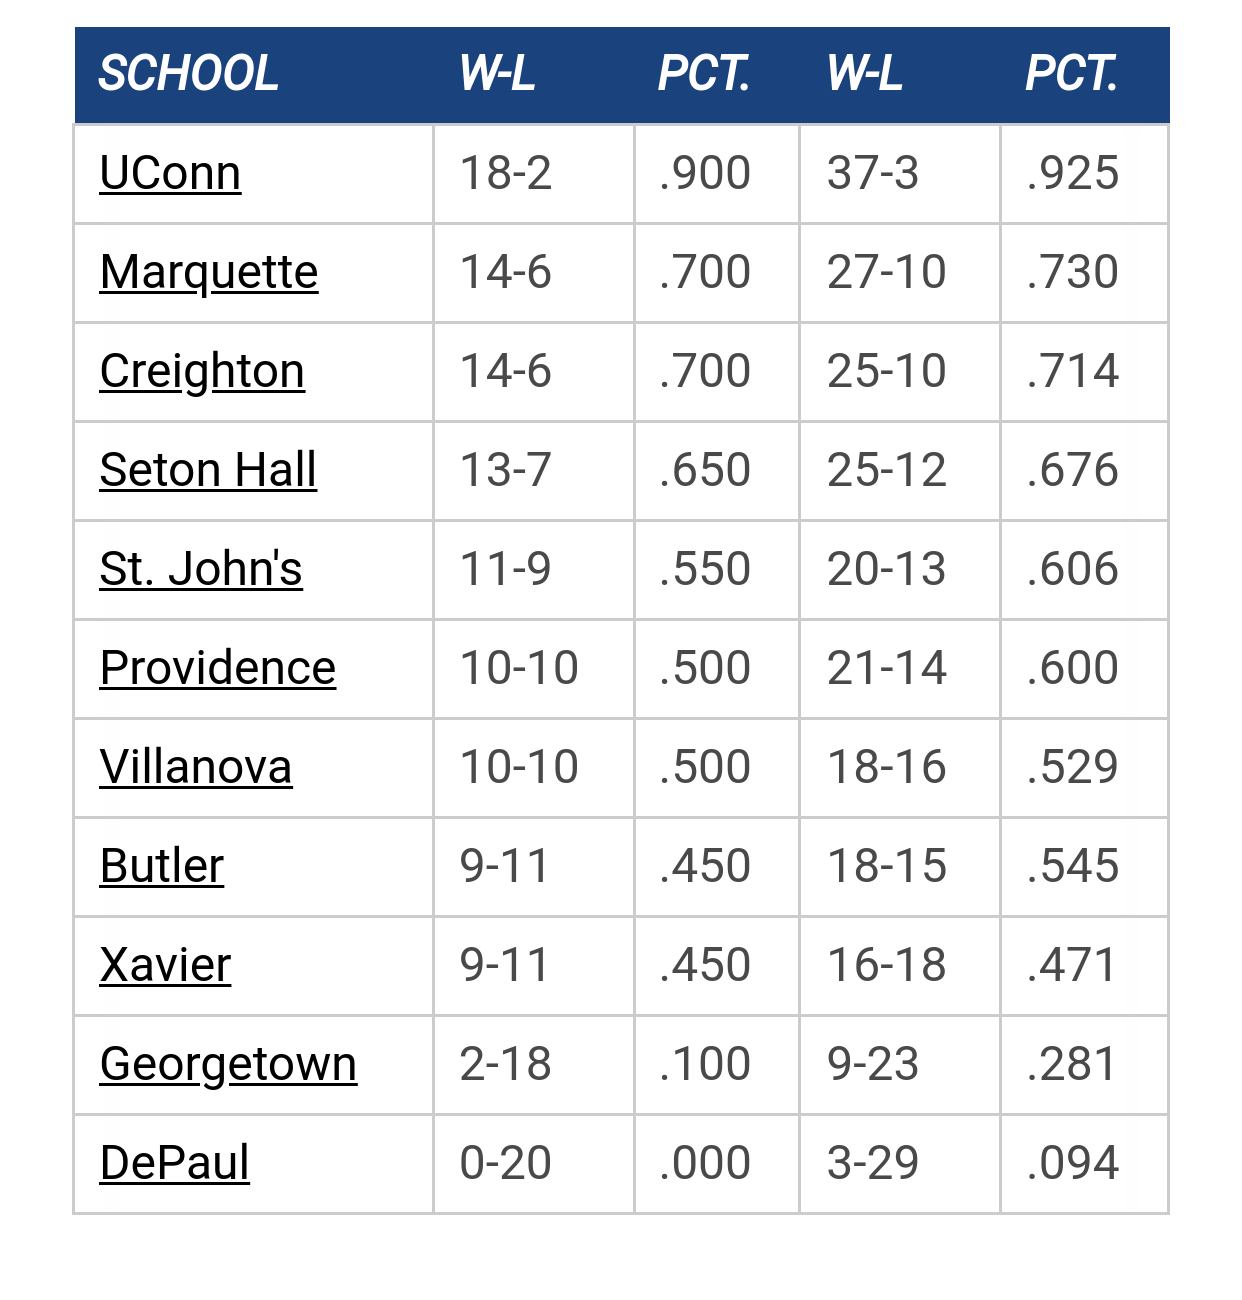
* Big East Standings

* Recent Posts

[Paint Touches] Big East programs ranked by NBA representation by TAMU, Knower of Ball
[Today at 10:48:14 PM]


2024 Transfer Portal by MuMark
[Today at 10:13:14 PM]


Big East 2024 Offseason by tower912
[Today at 08:53:54 PM]


Banquet by tower912
[Today at 07:39:53 PM]


Recruiting as of 3/15/24 by MuMark
[Today at 04:23:26 PM]


[New to PT] Big East Roster Tracker by mugrad_89
[Today at 12:29:11 PM]


Kolek throwing out first pitch at White Sox game by MU82
[Today at 08:16:25 AM]

Please Register - It's FREE!

The absolute only thing required for this FREE registration is a valid e-mail address.  We keep all your information confidential and will NEVER give or sell it to anyone else.
Login to get rid of this box (and ads) , or register NOW!

* Next up: The long cold summer

Marquette
Marquette

Open Practice

Date/Time: Oct 11, 2024 ???
TV: NA
Schedule for 2023-24
27-10

Author Topic: Experiment: Testing RPI Wizard  (Read 3631 times)

brewcity77

  • All American
  • *****
  • Posts: 26465
  • Warning-This poster may trigger thin skinned users
    • Cracked Sidewalks
Experiment: Testing RPI Wizard
« on: January 11, 2016, 03:13:37 PM »
There has been much discussion in the RPI thread about the merits of RPI Wizard. Included in that is how accurate it (or any system) can predict records, how accurate the approximated RPI will be, and frankly if it has any value at all.

I'm going to do an experiment. I'm going to look at a number of teams and see how well RPI Wizard predicts them from today, January 11, to the end of conference play (for the included teams) on March 6. I'll include all of the Big East, two teams from each of the P5 conferences that are in the mix for bids, and a handful of teams from mid to low major leagues to see where it has the most value, if there is any value to be had. Some teams were considered but left out because of early conference tournaments, including BYU, Monmouth, and Belmont.

I'm going to use total wins as the primary measuring stick. The win totals will be using the percentages given with the highest percentage wins being the first ones chosen. I will give pretty much every MU possibility, and narrow the focus to within 3 wins of expected for other teams. Some may fall outside, but I'm hoping we get enough to reasonably make an assessment. The bolded line is where RPI Wizard currently expects the team to finish. All of the calculations will be using the actual RPI Wizard application, not the projected numbers on RPIForecast.com. I'll be ignoring conference tournaments because there's too much potential for randomization of opponents.

I tried picking teams that were somewhat interesting for the non-Big East comparisons. As of this writing, all of the teams are projected to either be in the field or on the bubble by Joe Lunardi. Well...all except Wisconsin. Because I thought they'd be interesting even if they are well outside the field.

Marquette
15-16 (4-14): 166
16-15 (5-13): 151
17-14 (6-12): 135
18-13 (7-11): 117
19-12 (8-10): 104
20-11 (9-9): 81
21-10 (10-8): 69
22-9 (11-7): 57
23-8 (12-6): 44
24-7 (13-5): 29
25-6 (14-4): 25
26-5 (15-3): 21
27-4 (16-2): 18

Butler
19-11 (8-10): 54
20-10 (9-9): 43
21-9 (10-8): 35
22-8 (11-7): 26
23-7 (12-6): 22
24-6 (13-5): 18
25-5 (14-4): 15

Creighton
16-15 (7-11): 124
17-14 (8-10): 109
18-13 (9-9): 87
19-12 (10-8): 74
20-11 (11-7): 60
21-10 (12-6): 44
22-9 (13-5): 36

DePaul
7-23 (1-17): 208
8-22 (2-16): 191
9-21 (3-15): 182
10-20 (4-14): 168
11-19 (5-13): 157
12-18 (6-12): 143
13-17 (7-11): 119

Georgetown
13-18 (6-12): 123
14-17 (7-11): 112
15-16 (8-10): 95
16-15 (9-9): 75
17-14 (10-8): 61
18-13 (11-7): 49
19-12 (12-6): 37

Providence
19-12 (7-11): 54
20-11 (8-10): 43
21-10 (9-9): 35
22-9 (10-8): 26
23-8 (11-7): 21
24-7 (12-6): 17
25-6 (13-5): 16

Seton Hall
16-14 (6-12): 111
17-13 (7-11): 92
18-12 (8-10): 74
19-11 (9-9): 60
20-10 (10-8): 46
21-9 (11-7): 36
22-8 (12-6): 27

St. John's
6-24 (0-18): 239
7-23 (1-17): 227
8-22 (2-16): 215
9-21 (3-15): 205
10-20 (4-14): 186
11-19 (5-13): 170

Villanova
23-8 (12-6): 12
24-7 (13-5): 10
25-6 (14-4): 4
26-5 (15-3): 4
27-4 (16-2): 2
28-3 (17-1): 1
29-2 (18-0): 1

Xavier
23-7 (11-7): 12
24-6 (12-6): 8
25-5 (13-5): 4
26-4 (14-4): 4
27-3 (15-3): 2
28-2 (16-2): 1
29-1 (17-1): 1

West Virginia (Big 12)
22-9 (11-7): 19
23-8 (12-6): 15
24-7 (13-5): 12
25-6 (14-4): 8
26-5 (15-3): 5
27-4 (16-2): 4
28-3 (17-1): 2

Texas (Big 12)
12-19 (3-15): 115
13-18 (4-14): 95
14-17 (5-13): 77
15-16 (6-12): 63
16-15 (7-11): 51
17-14 (8-10): 39
18-13 (9-9): 26

Louisville (ACC)
21-10 (10-8): 21
22-9 (11-7): 15
23-8 (12-6): 13
24-7 (13-5): 5
25-6 (14-4): 4
26-5 (15-3): 2
27-4 (16-2): 2

Notre Dame (ACC)
15-15 (6-12): 107
16-14 (7-11): 85
17-13 (8-10): 72
18-12 (9-9): 57
19-11 (10-8): 45
20-10 (11-7): 37
21-9 (12-6): 26

UCLA (Pac-12)
14-17 (5-13): 107
15-16 (6-12): 87
16-15 (7-11): 74
17-14 (8-10): 54
18-13 (9-9): 43
19-12 (10-8): 28
20-11 (11-7): 23

Arizona State (Pac-12)
14-17 (4-14): 104
15-16 (5-13): 86
16-15 (6-12): 72
17-14 (7-11): 55
18-13 (8-10): 44
19-12 (9-9): 29
20-13 (10-8): 23

Indiana (Big 10)
20-11 (10-8): 75
21-10 (11-7): 58
22-9 (12-6): 45
23-8 (13-5): 37
24-7 (14-4): 25
25-6 (15-3): 19
26-5 (16-2): 15

Wisconsin (Big 10)
12-19 (4-14): 145
13-18 (5-13): 126
14-17 (6-12): 110
15-16 (7-11): 92
16-15 (8-10): 77
17-14 (9-9): 61
18-13 (10-8): 50

Texas A&M (SEC)
22-9 (11-7): 31
23-8 (12-6): 22
24-7 (13-5): 16
25-6 (14-4): 15
26-5 (15-3): 11
27-4 (16-2): 7
28-3 (17-1): 4

LSU (SEC)
14-17 (7-11): 164
15-16 (8-10): 151
16-15 (9-9): 125
17-14 (10-8): 109
18-13 (11-7): 87
19-12 (12-6): 73
20-11 (13-5): 55

Connecticut (American)
19-12 (9-9): 81
20-11 (10-8): 70
21-10 (11-7): 52
22-9 (12-6): 45
23-8 (13-5): 37
24-7 (14-4): 26
25-6 (15-3): 20

Dayton (Atlantic 10)
20-10 (10-8): 44
21-9 (11-7): 29
22-8 (12-6): 22
23-7 (13-5): 18
24-6 (14-4): 16
25-5 (15-3): 11
26-4 (16-2): 7

UT-Arlington (Sun Belt)
22-9 (13-7): 81
23-8 (14-6): 72
24-7 (15-5): 57
25-6 (16-4): 51
26-5 (17-3): 38
27-4 (18-2): 29
28-3 (19-1): 25

Hawaii (Big West)
19-8 (10-6): 141
20-7 (11-5): 117
21-6 (12-4): 86
22-5 (13-3): 74
23-4 (14-2): 58
24-3 (15-1): 47
25-2 (16-0): 38

Jackson State (SWAC)
14-15 (11-7): 243
15-14 (12-6): 229
16-13 (13-5): 210
17-12 (14-4): 190
18-11 (15-3): 178
19-10 (16-2): 160
20-9 (17-1): 150
This space reserved for a 2024 2025 National Championship celebration banner.

Jay Bee

  • All American
  • *****
  • Posts: 9062
Re: Experiment: Testing RPI Wizard
« Reply #1 on: January 11, 2016, 04:31:38 PM »
I'm going to use total wins as the primary measuring stick. The win totals will be using the percentages given with the highest percentage wins being the first ones chosen. I will give pretty much every MU possibility, and narrow the focus to within 3 wins of expected for other teams. Some may fall outside, but I'm hoping we get enough to reasonably make an assessment.

Wat?

I think you are not then testing the RPIWizard, rather you are testing Sagarin's Predictor.
Thanks for ruining summer, Canada.

brewcity77

  • All American
  • *****
  • Posts: 26465
  • Warning-This poster may trigger thin skinned users
    • Cracked Sidewalks
Re: Experiment: Testing RPI Wizard
« Reply #2 on: January 11, 2016, 04:43:58 PM »
Wat?

I think you are not then testing the RPIWizard, rather you are testing Sagarin's Predictor.

Not really. I'm more interested in where the RPI comes out relative to total wins. It will see how close these teams get to the Sagarin number as well, but my main interest is how close their actual RPI is to predicted. I need a variety of win totals (thus the 7-game range) because obviously not all of these teams will finish with the expected values as of today. Using total wins because a few teams on this list still play non-con games between now and the end of the season.
This space reserved for a 2024 2025 National Championship celebration banner.

Jay Bee

  • All American
  • *****
  • Posts: 9062
Re: Experiment: Testing RPI Wizard
« Reply #3 on: January 11, 2016, 05:53:02 PM »
Not really. I'm more interested in where the RPI comes out relative to total wins. It will see how close these teams get to the Sagarin number as well, but my main interest is how close their actual RPI is to predicted. I need a variety of win totals (thus the 7-game range) because obviously not all of these teams will finish with the expected values as of today. Using total wins because a few teams on this list still play non-con games between now and the end of the season.

Gotcha now. The one thing to look for will be teams that did differently than projected with respect to home vs. road... and the impact on their Adj W-L... but, a worthwhile exercise you're doing.
Thanks for ruining summer, Canada.

mu03eng

  • Registered User
  • All American
  • *****
  • Posts: 5049
    • Scrambled Eggs Podcast
Re: Experiment: Testing RPI Wizard
« Reply #4 on: January 12, 2016, 08:44:03 AM »
Good luck and god speed my friend
"A Plan? Oh man, I hate plans. That means were gonna have to do stuff. Can't we just have a strategy......or a mission statement."

Benny B

  • All American
  • *****
  • Posts: 5969
Re: Experiment: Testing RPI Wizard
« Reply #5 on: January 12, 2016, 01:02:03 PM »
Much gratitude Brew.  Although I, evidently, have way too much time on my hands, I am thankful I do not have to put this experiment together myself (for my own peace of mind).
Wow, I'm very concerned for Benny.  Being able to mimic Myron Medcalf's writing so closely implies an oncoming case of dementia.

Dawson Rental

  • All American
  • *****
  • Posts: 10455
  • I prefer a team that's eligible, not paid for
Re: Experiment: Testing RPI Wizard
« Reply #6 on: January 12, 2016, 02:21:02 PM »
Really cool idea, my friend.  This should be one of the more interesting threads this season.  Thanks for crunching the numbers.
You actually have a degree from Marquette?

Quote from: muguru
No...and after reading many many psosts from people on this board that do...I have to say I'm MUCH better off, if this is the type of "intelligence" a degree from MU gets you. It sure is on full display I will say that.

WarhawkWarrior

  • Team Captain
  • ****
  • Posts: 276
Re: Experiment: Testing RPI Wizard
« Reply #7 on: January 12, 2016, 05:16:32 PM »
Great work.  Rather disappointing that we need 22 wins to even be considered.  That isn't happening so we need to recalibrate any expectation.  NIT baby!  Maybe.

brewcity77

  • All American
  • *****
  • Posts: 26465
  • Warning-This poster may trigger thin skinned users
    • Cracked Sidewalks
Re: Experiment: Testing RPI Wizard
« Reply #8 on: January 12, 2016, 05:30:49 PM »
Great work.  Rather disappointing that we need 22 wins to even be considered.  That isn't happening so we need to recalibrate any expectation.  NIT baby!  Maybe.

Keep the faith! If we can sweep DePaul and St. John's, then beat Providence, Georgetown, Creighton, and Butler at home, we would only need to go 2-5 in our other 7 games. Maybe not likely, but doable.
This space reserved for a 2024 2025 National Championship celebration banner.

brewcity77

  • All American
  • *****
  • Posts: 26465
  • Warning-This poster may trigger thin skinned users
    • Cracked Sidewalks
Re: Experiment: Testing RPI Wizard
« Reply #9 on: March 07, 2016, 01:20:03 PM »
Okay...first part of the test. Simply looking at the raw numbers and seeing how close the Wizard got. I expect discrepancies for two reasons. First, in every instance, I used the most likely wins and losses, so the actual wins and losses will differ from that. Second, it is using numbers based on the entire country going to form, which obviously never happens. But anyway...let's go:

Marquette

19-12 (8-10): 104

Actual Marquette RPI: 108 (-4)

Butler

21-9 (10-8): 35

Actual Butler RPI: 46 -11)

Creighton

18-13 (9-9): 87

Actual Creighton RPI: 98 (-11)

DePaul

9-21 (3-15): 182

Actual DePaul RPI: 187 (-5)

Georgetown

14-17 (7-11): 112

Actual Georgetown RPI: 103 (+9)

Providence

22-9 (10-8): 26

Actual Providence RPI: 44 (-18)

Seton Hall

22-8 (12-6): 27

Actual Seton Hall RPI: 32 (-5)

St. John's

7-23 (1-17): 227

Actual St. John's RPI: 233 (-6)

Villanova

27-4 (16-2): 2

Actual Villanova RPI: 3 (-1)

Xavier

26-4 (14-4): 4

Actual Xavier RPI: 6 (-2)

West Virginia (Big 12)

24-7 (13-5): 12

Actual West Virginia RPI: 10 (+2)

Texas (Big 12)

20-11 (11-7): OFF

Texas cannot be measured as they outperformed their expectations beyond the initial calculations.

Louisville (ACC)

23-8 (12-6): 13

Actual Louisville RPI: 17 (-4)

Notre Dame (ACC)

20-10 (11-7): 37

Actual Notre Dame RPI: 36 (+1)

UCLA (Pac-12)

15-16 (6-12): 87

Actual UCLA RPI: 97 (-10)

Arizona State (Pac-12)

15-16 (5-13): 86

Actual Arizona State RPI: 96 (-10)

Indiana (Big 10)

25-6 (15-3): 19

Actual Indiana RPI: 19 (+/- 0)

Wisconsin (Big 10)

20-11 (12-6): OFF

Wisconsin cannot be measured as they outperformed their expectations beyond the initial calculations.

Texas A&M (SEC)

24-7 (13-5): 16

Actual Texas A&M RPI: 22 (-6)

LSU (SEC)

18-13 (11-7): 87

Actual LSU RPI: 90 (-3)

Connecticut (American)

21-10 (11-7): 52

Actual Connecticut RPI: 57 -5)

Dayton (Atlantic 10)

24-6 (14-4): 16

Actual Dayton RPI: 21 (-5)

UT-Arlington (Sun Belt)

21-9 (13-7): 81

Actual UT-Arlington RPI: 101 (-20)

Hawaii (Big West)

22-5 (13-3): 74

Actual Hawaii RPI: 92 (-18)

Jackson State (SWAC)

15-14 (12-6): 229

Actual Jackson State RPI: 225 (+4)
« Last Edit: March 07, 2016, 01:22:10 PM by brewcity77 »
This space reserved for a 2024 2025 National Championship celebration banner.

brewcity77

  • All American
  • *****
  • Posts: 26465
  • Warning-This poster may trigger thin skinned users
    • Cracked Sidewalks
Re: Experiment: Testing RPI Wizard
« Reply #10 on: March 07, 2016, 01:30:55 PM »
Average Margin of Discrepancy (23 teams): -5.57

Number of Highly Accurate (+/- 5) Predictions: 13 (56.5%)

Number of Moderately Accurate (+/- 6-10) Predictions: 5 (21.7%)

Number of Moderately Inaccurate (+/- 11-15) Predictions: 2 (8.7%)

Number of Wildly Inaccurate (+/- 16 or more) Predictions: 3 (13.0%)

Largest Positive Difference: Georgetown (+11)

Largest Negative Difference: UT-Arlington (-20)
« Last Edit: March 07, 2016, 01:43:30 PM by brewcity77 »
This space reserved for a 2024 2025 National Championship celebration banner.

brewcity77

  • All American
  • *****
  • Posts: 26465
  • Warning-This poster may trigger thin skinned users
    • Cracked Sidewalks
Re: Experiment: Testing RPI Wizard
« Reply #11 on: March 07, 2016, 01:59:14 PM »
After looking at the results, here are my thoughts...
.
  • For the most part, the predictor is accurate to about 10 places in the RPI. 78.3% of the teams analyzed were accurate within 10 spots. It's also encouraging that more than half the teams analyzed (56.5%) were in the highly accurate category of +/-5.
  • I'm baffled as to why in general the numbers came out lower than expected almost across the board. Of the teams analyzed, 18 finished lower than predicted, 1 finished exactly where predicted, and only 4 finished higher than predicted. Perhaps my sample size wasn't large enough, but I expected the average to be closer to zero, especially when more than half the teams measured were closer to the mean (+/- 5) than the average margin away from the mean (-5.57).
  • Definitely some predictions falling in the wildly inaccurate category. Two came from mid-majors (Arlington and Hawaii), but the most notable one to me is Providence. Looking at their graph on RPI Forecast, their expected RPI was always 10-20 spots lower than their then "current RPI" until the beginning of March. Looking at a few other graphs, not many teams have that wide a discrepancy.
.
While the RPI Wizard has its uses, it isn't without flaws. The vast majority of teams were fairly accurate. However 21.7% were pretty far off the mark, so while there's a better than average chance the Wizard will get it right within 5 places, there's also a decent chance it will be well off the mark, regardless of conference affiliation, as Providence, Georgetown, UCLA, Arlington, and Hawaii all show.

One thing I wonder about it...with so many teams coming in below their expected mark, does the program instantly round teams up? Looking at both Villanova and Xavier coming in close but under what was expected makes me wonder how many of the top-10 teams would have come in similarly below expectations. In retrospect, I wish I had picked more teams in that area. Maybe next year.

Also...as Jay Bee mentioned, this is also testing the Sagarin predictor...but that's an analysis for another day. It will be easier to come back and look at this and see how far off the expected total teams were than it is to analyze the RPI, which will fluctuate within the coming days as conference tournaments kick off.
This space reserved for a 2024 2025 National Championship celebration banner.


feedback